Lecture 11 - Transcriptomics
Genome expression is regulated at multiple levels
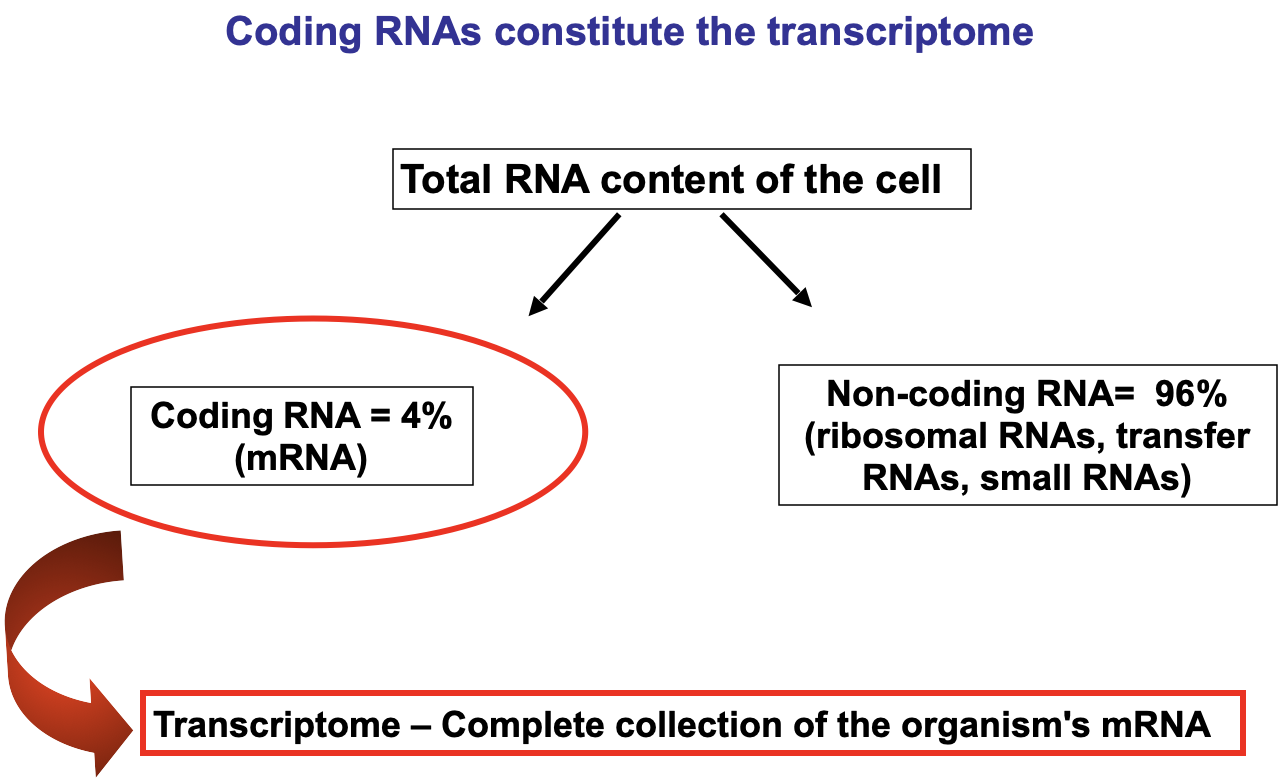
Transcriptome → all the products of gene expression, such as mRNA, which carries instructions for building proteins, as well as noncoding RNAs like microRNAs and long-noncoding RNAs
Control mechanisms at each step of transcription and translation allow for the transcriptome composition to be altered in a controlled manner
For example, chromatin remodelling makes genes accessible for transcription
Features of the transcriptome
Reflects current status of the cell
Represents the small percent of genomic information transcribed into RNA
Contain hundreds if not thousands of different mRNAs
Each gene may produce different types of mRNA so the transcriptome is more complex and dynamic than the genome
Genome is stable, transcriptome is variable
Analysis provides a view of when and where a gene is switched on or off in various types of cells and tissues
Cell-specific expression of genes with unknown function may provide clue to their function and their relationship to disease
Differences in the transcriptome of healthy and diseased cells provides a diagnostic tool → disease specific expression pattern
To characterise a transcriptome it is necessary to identify the mRNAs that it contains and determine their relative abundance
Traditional techniques to quantify gene expression (Northern Blot, RT-PCR, Q-PCR) only allow the study of a few genes at a time
The human genome has approximately 30,000 genes so how can we quantify all these in one experiment?
Microarrays
Quantification of Global Gene Expression
Measure the levels of transcript from a large number of genes in one experiment
Allow for the comparison of:
Gene regulation in cellular processes → co-regulated genes
Healthy vs Diseased state
Influence of drugs → drug discovery
Microarray → from the Greek mikro (small) and French arayer (arranged)
It is a set of probes, PCR probes or short oligonucleotides that have been immobilised onto a surface
This generates a DNA chip
Each probe represents a specific gene and high density arrays contain all genes of a given genome
The position of each probe is known
Types of microarrays
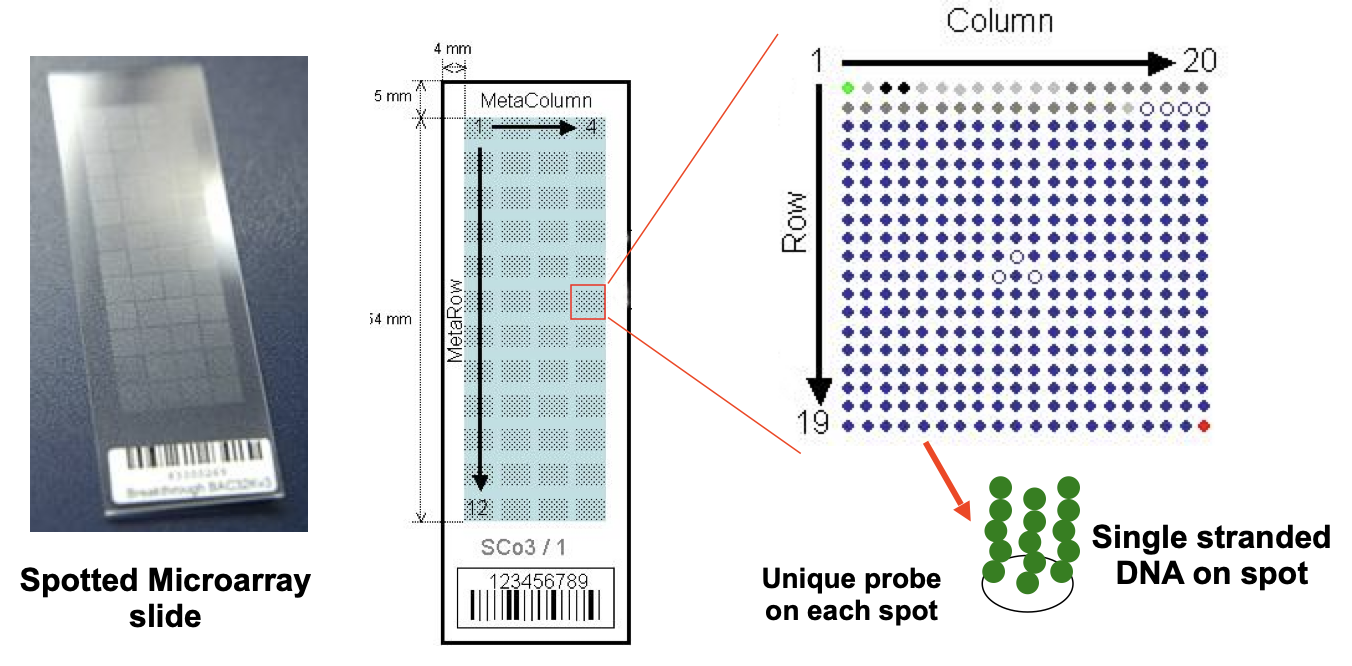
Spotted arrays (Stanford-like chips)
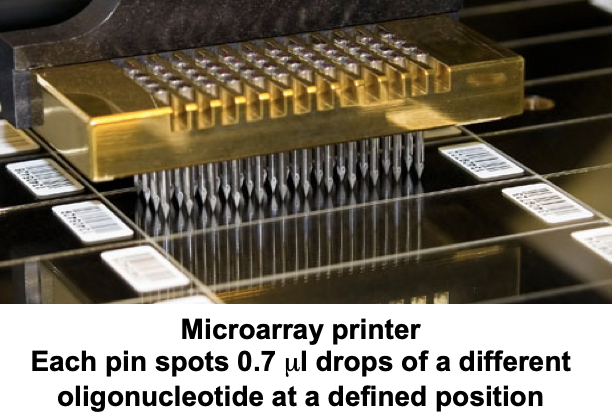
cDNA, PCR products or oligonucleotides are spotted by a robot onto the surface of a glass slide at a precise location
After cross-linking to chemical groups on glass surface, the DNA must be denatured to convert to a single strand
One gene, one probe
Disadvantages:
Sequence homology between genes leads to cross-hybridisation and failure to specifically detect some transcripts
In situ olignucleotide array (Affymetrix arrays)
Chemically in situ synthesised single stranded oligos (25 bases long)
Allow high density of spots on the chip → 500000 different probes placed within 1.28 cm2
Multiple probes representing a gene improves specificity and reproducibility
One gene, several probes
Overview of a Microarray experiment
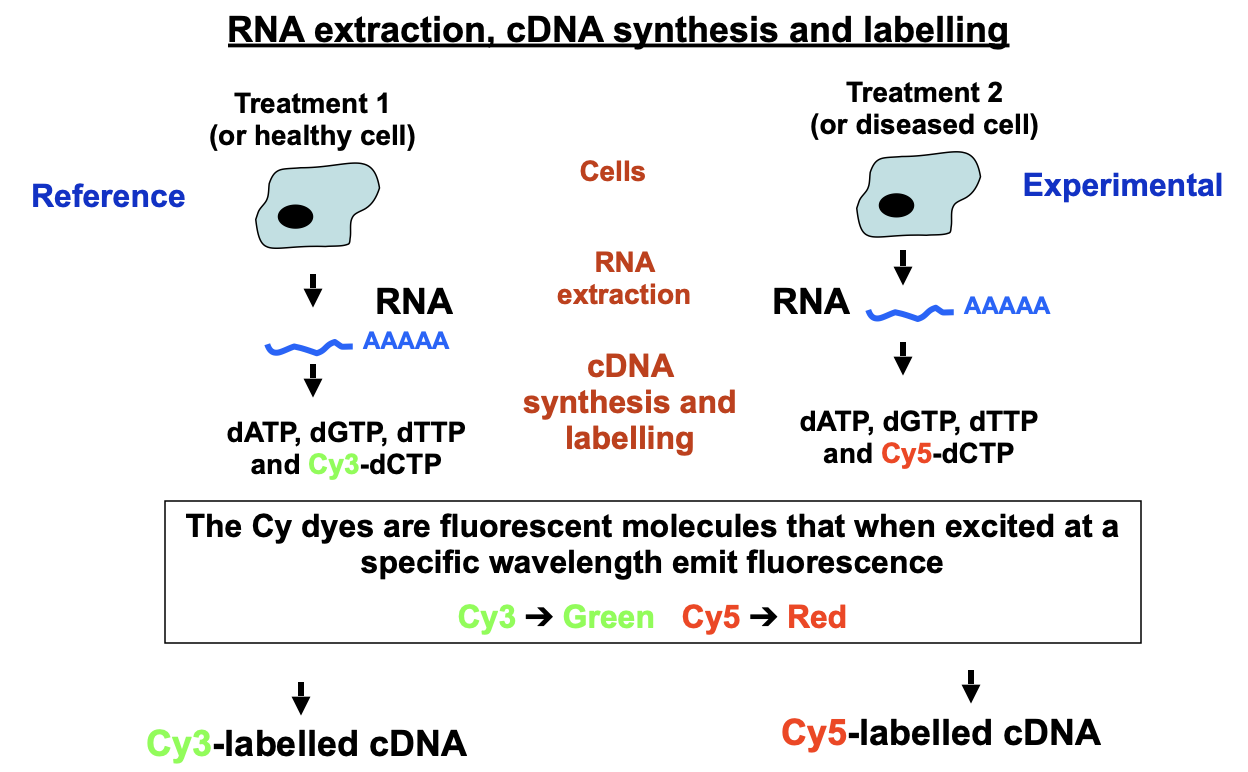
Based on nucleic acid hybridisation → labelled cDNAs will hybridise with their complementary spot on the Microarray CHIP
Fluorescent molecules are also added so that both samples will have different fluorescent labelled cDNA
Hybridisation and Detection
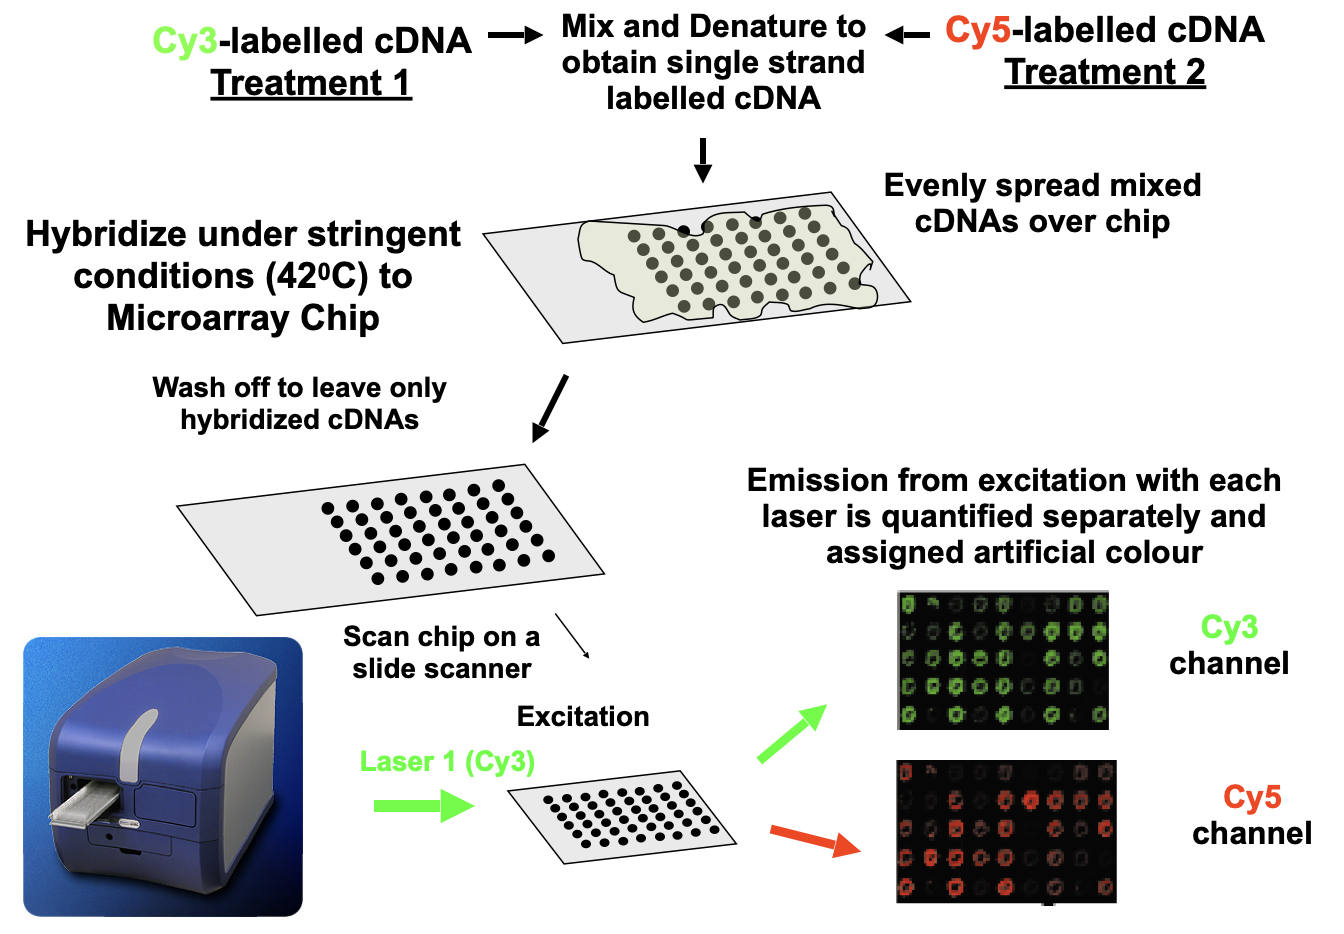
Cy3-labelled DNA and Cy5-labelled DNA are mixed and denatured to obtain a single strand of labelled cDNA
They are evenly spread over the CHIP
They hybridise under stringent conditions (420C) to Microarray Chip
Wash off to leave only the hybridised cDNA
Scan the CHIP on a slide scanner
Emission from excitation with each laser is quantified separately and assigned artificial colour
Fluorescence of each spot indicates relative amount of each mRNA species in original samples
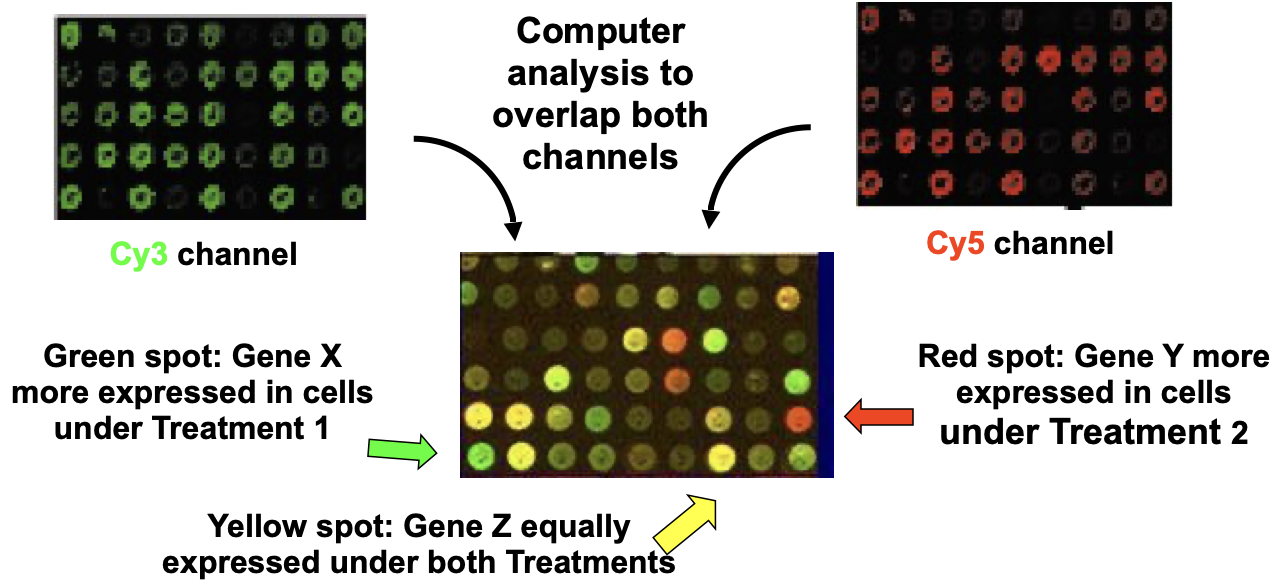
Fluorescence intensity (raw data) from each spot is quantified by computer software
Contrasted against reference spots on the CHIP and background fluorescence
Data from replicate chips is averages
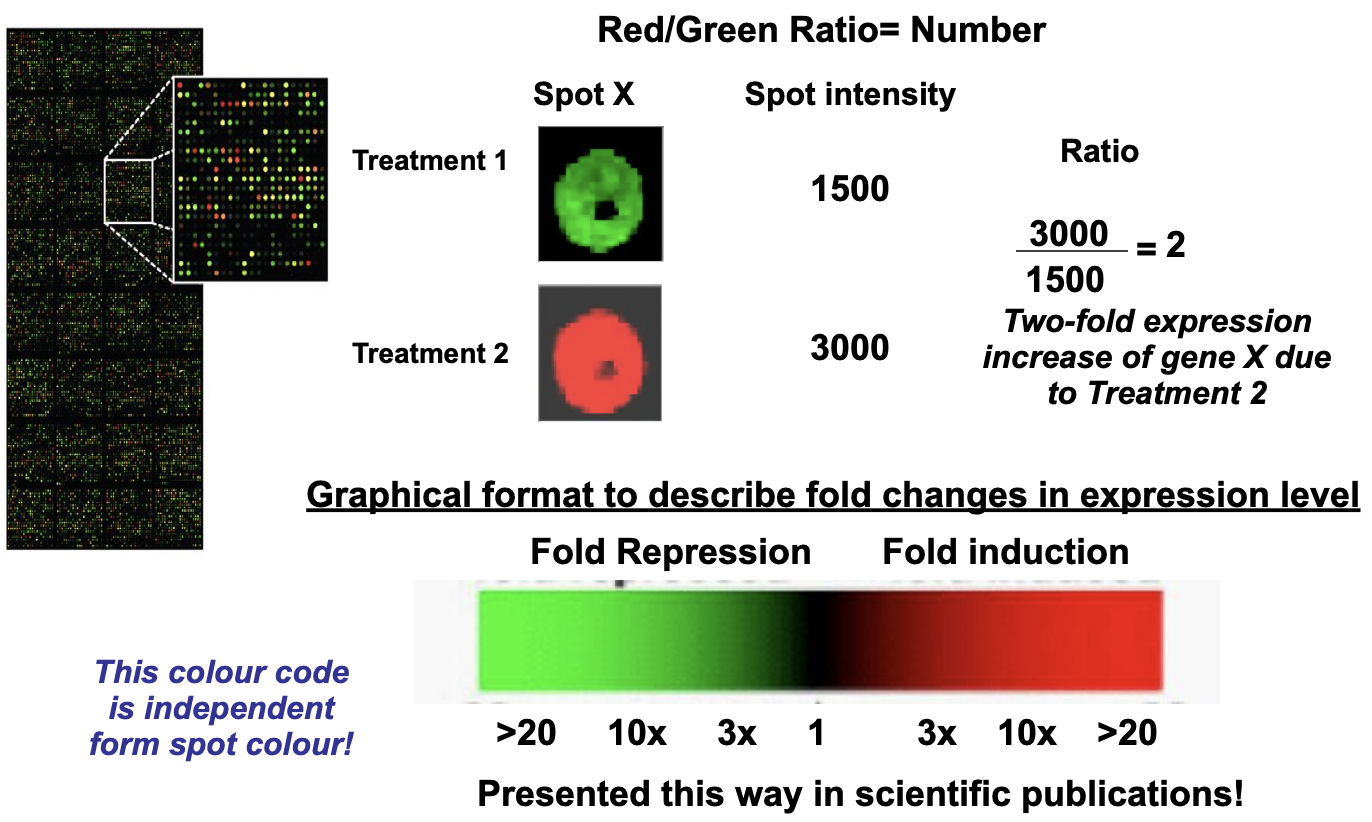
A number is generated for each gene (spot) which is then made into a ratio between Red and Green
Microarray Data Analysis
Low level analysis → difference in expression levels of a gene between experimental treatments

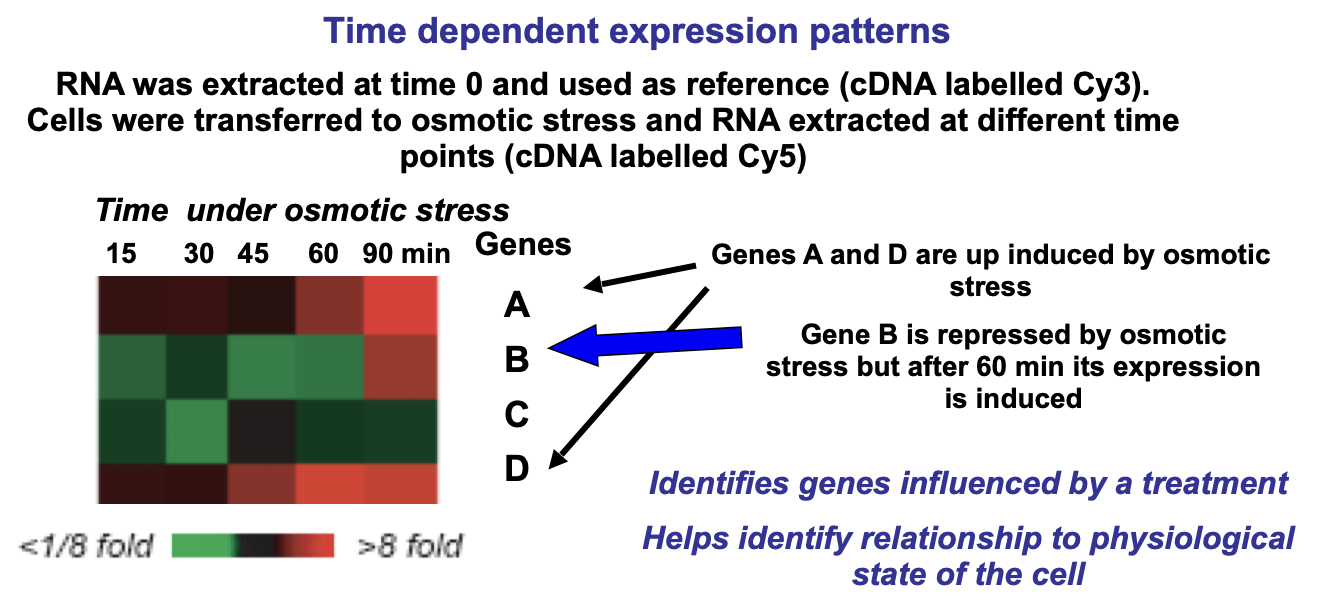
High-Level analysis → grouping of genes that respond similarly to experimental treatments
A similar expression pattern may indicate a related biological function
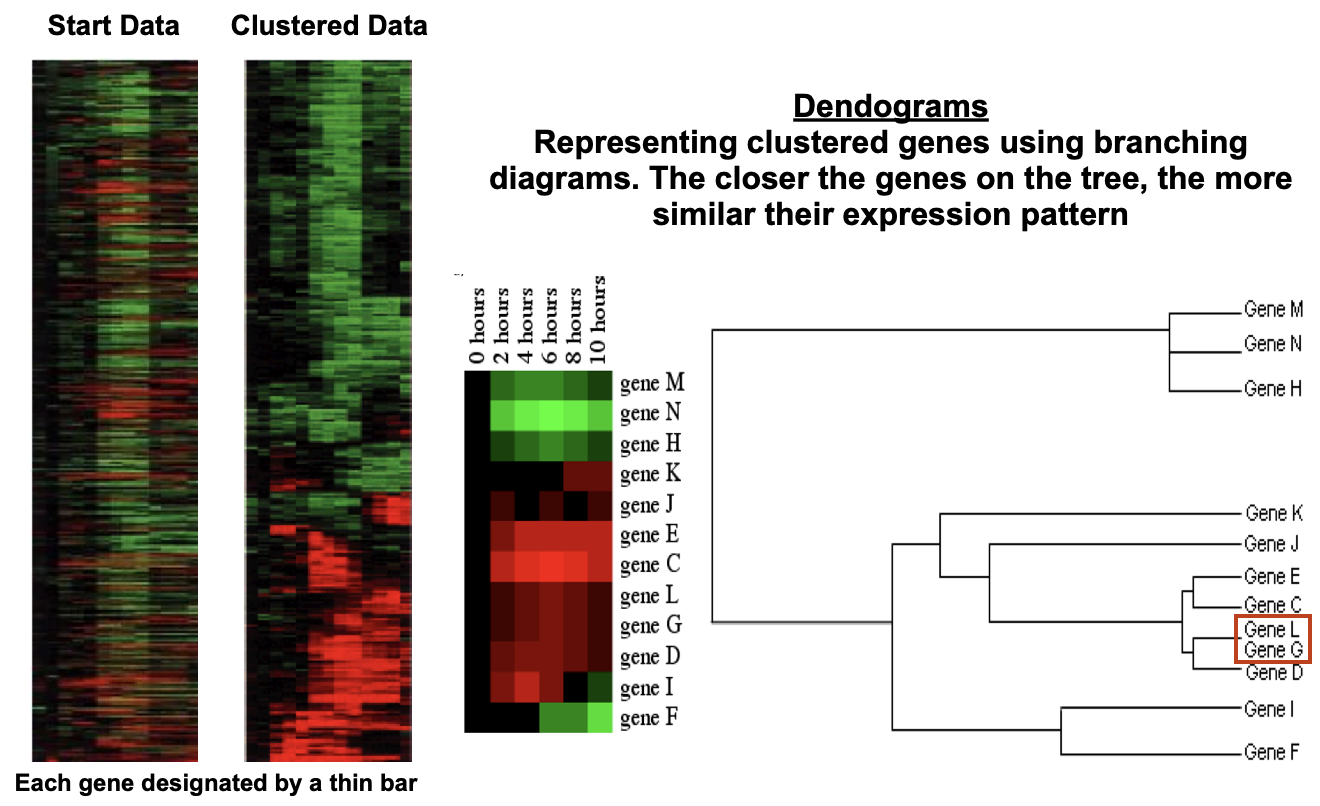
Can then be made into dendograms
Dendograms → represent clustered genes using branching diagrams, the closer the genes on the tree, the more similar their expression pattern
Validation of Microarray experiments
Microarray Data Analysis is not enough to reach conclusions
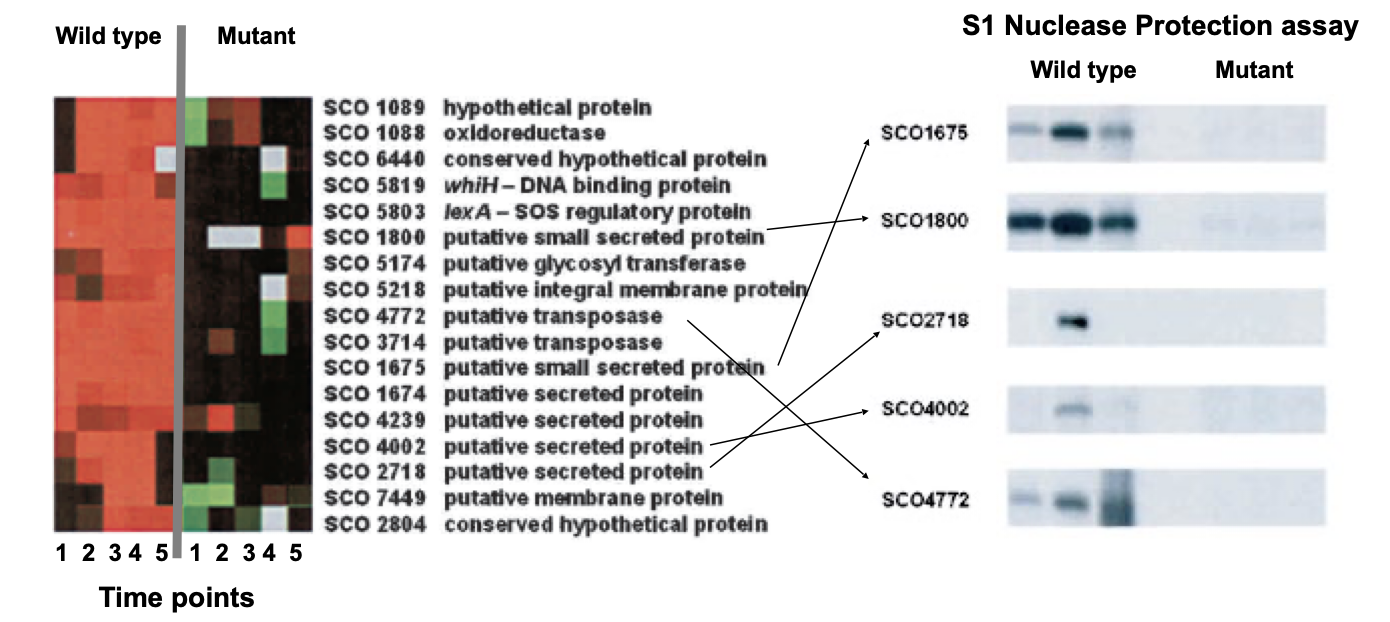
The observed differences in gene expression need to be corroborated using an alternative technique and the same RNAs used in the microarray experiment
These techniques include: Quantitative Real Time PCR, S1 Nuclease Protection, Northern Blot
Applications of Microarrays
Generate a view of overall gene expression patterns
Find targets of regulatory genes and analyse mutants
Identification of genes whose expression is associated to a physiological condition
Study of disease → useful diagnostic markers and potential targets for therapy
Pharmacogenomics → how genetic composition affects response to drugs
Characterising melanomas using microarrays
Samples from 83 melanomas were analysed for global gene expression and clustering was done based on gene expression similarities
Compared clinical data from each sample with clustering results
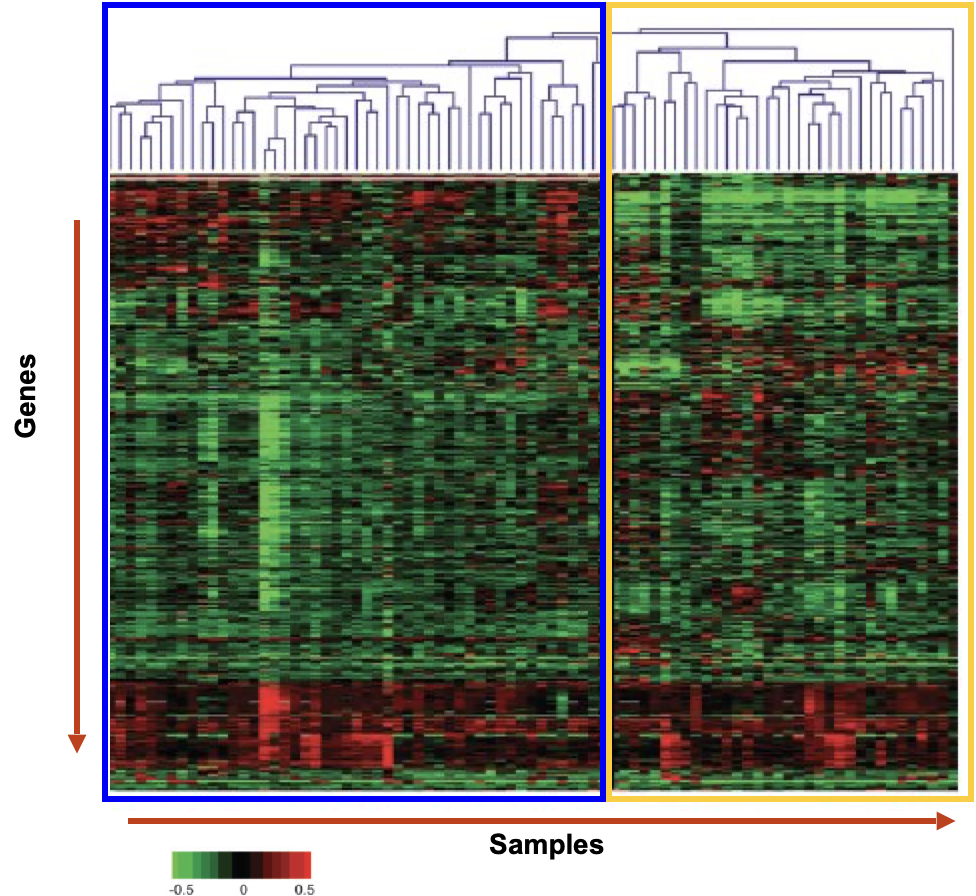
Blue group → No metastasis, good survival rate
Yellow group → Metastasis, poor survival rate
Gene expression pattern permits distinguishing improved survival in patients with melanoma from those with decreased probability of survival
Are microarrays really that good?
The same samples were independently processed using three major microarray platforms
Platforms only agreed on four genes out of 189 differentially expressed in the tested samples
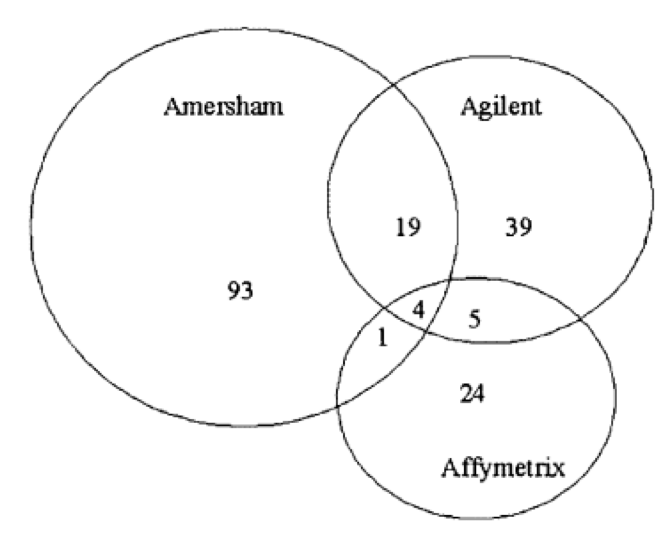
Reliability and reproducibility are determined by:
Experimental Design
Quality of the array platform
Correct statistical analysis of data
Disadvantages of using Microarrays
Based on hybridisation
Depends on previous genome sequence knowledge
Non-specific binding or cross-hybridisation may happen
Limited detection range and background and signal saturation
Must consider mismatches in sequences from different strains
Complex normalisation of experiments
RNA-Seq as an advantageous alternative
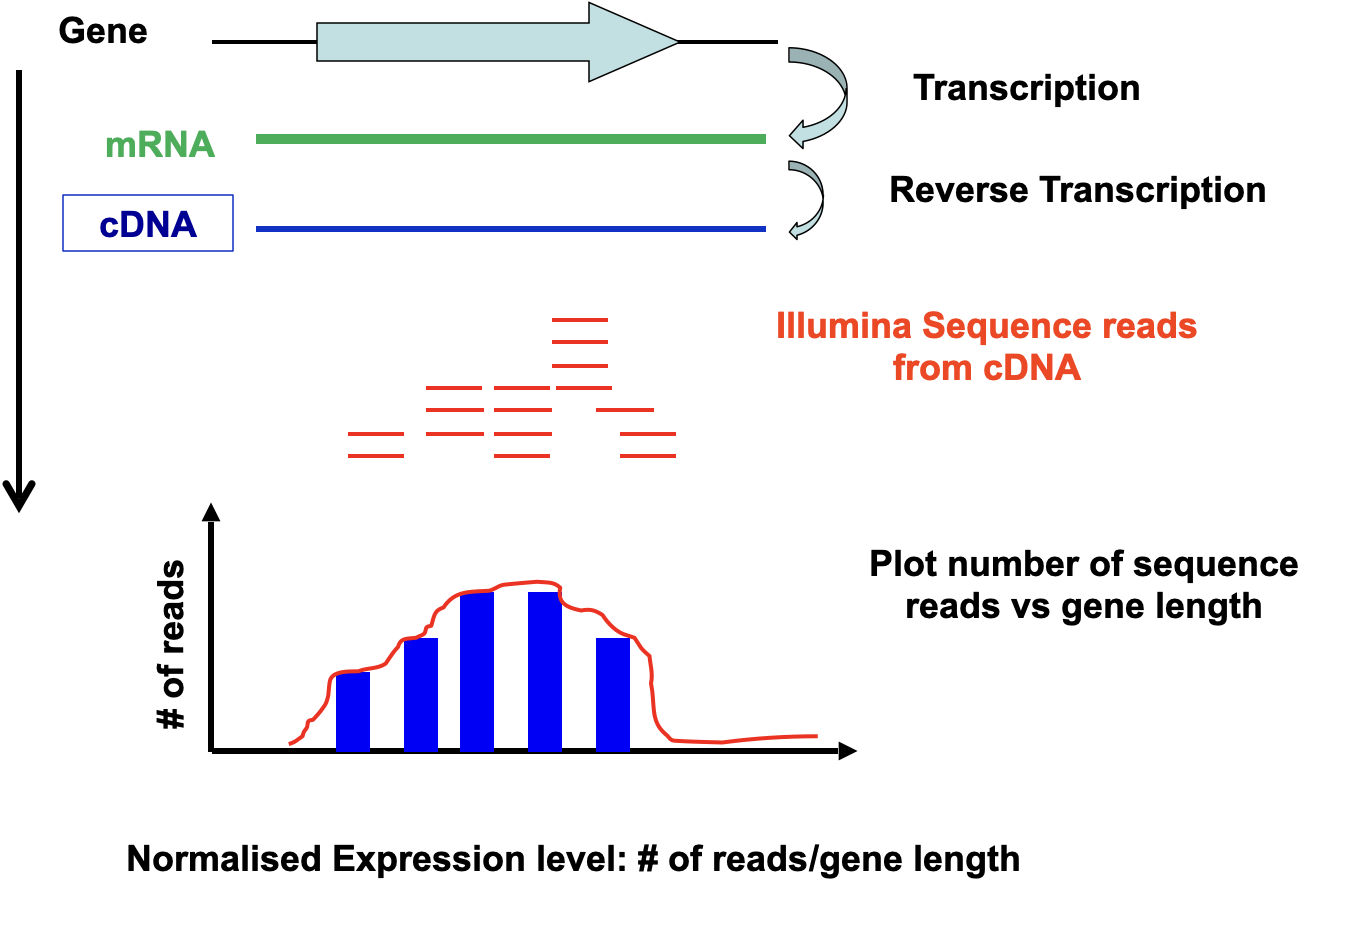
Based on high throughput sequencing (454, Illumina, SOLiD)
Convert all mRNA into cDNA followed by massive parallel sequencing
No need for a genome sequence → de novo sequencing
Maps transcription start and SNPs
Broad detection range
Good reproducibility
Method
RNA isolation and enrichment for mRNA (removal of rRNA and tRNA)
cDNA synthesis → random primers, polyT primers
Adapter ligation to cDNAs and sequencing
Align sequences to reference genome sequence (if available)
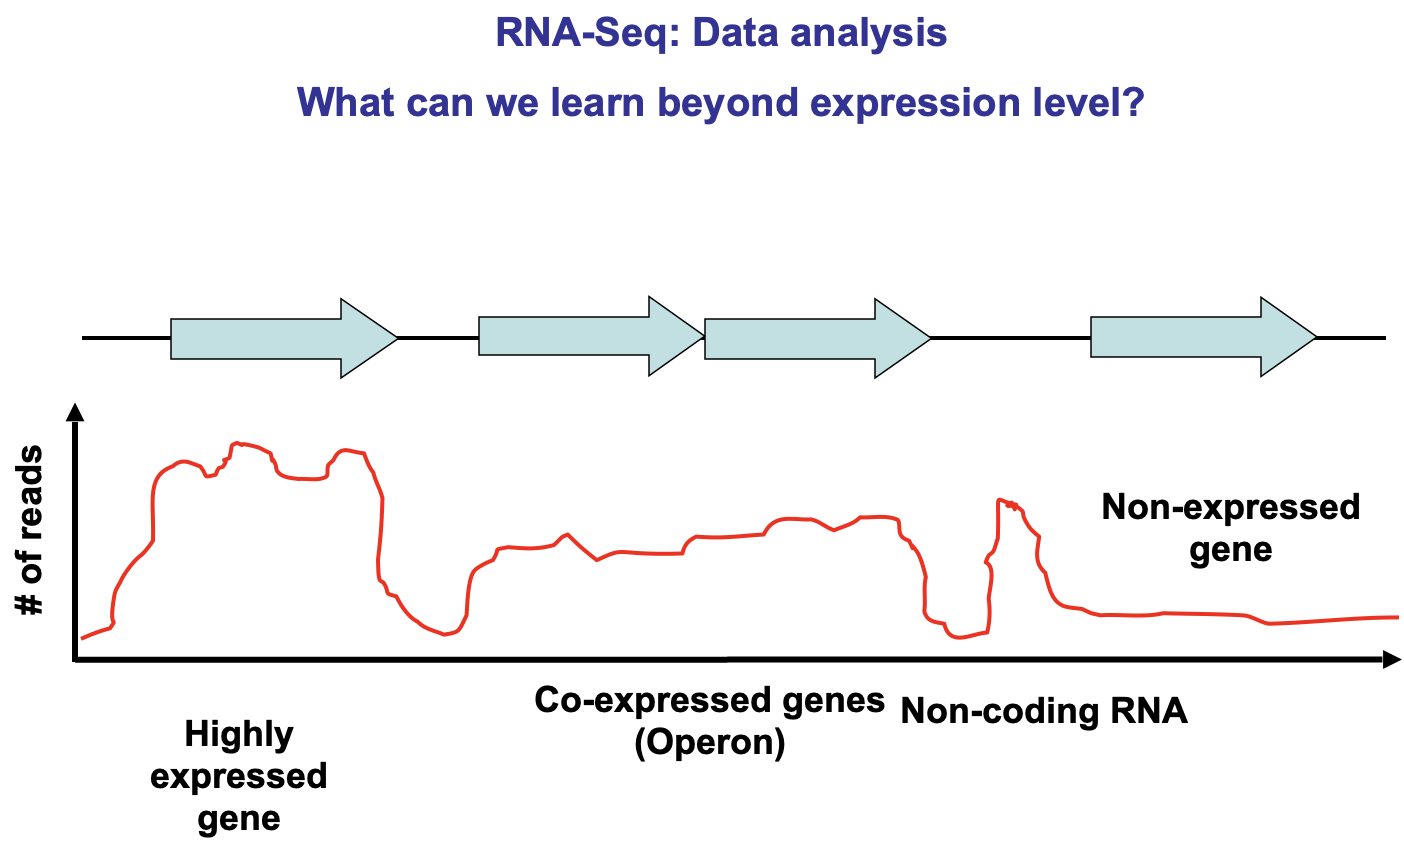
Data analysis