The Z and Distribution of Means
Let’s shift our focus from the Z score of an individual within a group to the Z statistic for a group
First, we will use means rather than individual scores because we are not studying a sample of many scores, but rather studying one individual score
The Z table can also be used to determine percentages and the statistics for distributions of means calculated from many people
The other changes that we need to calculate the mean and standard error for the distribution of means, before calculating the Z statistic
Shift in Focus: Group Statistics
The discussion then shifts from individual z-scores to group z-statistics:
1.) Let’s shift our focus from the Z score of an individual within a group to the Z statistic for a group
2.) First, we will use means rather than individual scores because we are not studying a sample of many scores, but rather studying one individual score
3.) The Z table can also be used to determine percentages and the statistics for distributions of means calculated from many people
4.) The other changes that we need to calculate the mean and standard error for the distribution of means before calculating the Z statistic
Calculating z-statistics for a Group
Example Setup:
Targeting a specific group (e.g., neurodivergent participants) to assess their IAT score reactions.
Collect data from 30 participants with a reported mean score of -0.16.
Symbolic Notation for Population Parameters:
Mean μ
μ = -0.16
Standard deviation σ:
σ = 0.14
Calculated standard error for the distribution of means σ_M:
Formula for standard error: σ_M = \frac{σ}{\sqrt{N}}
Substitute the values: σ_M = \frac{0.51}{\sqrt{30}} = 0.093
Steps to Calculate the z-statistic for a Group
STEP 1: Convert to a z-statistic using the mean and standard error.
Formula used:
Z=\frac{\left(M-\mu_{M}\right)}{\sigma_{M}} where M is the sample mean, Mu is the population mean, and Sigma is the standard error of the mean.
Substitute values:
(-0.16) - (-0.14) = -0.215
STEP 2: Determine the percentage below the computed z-statistic.
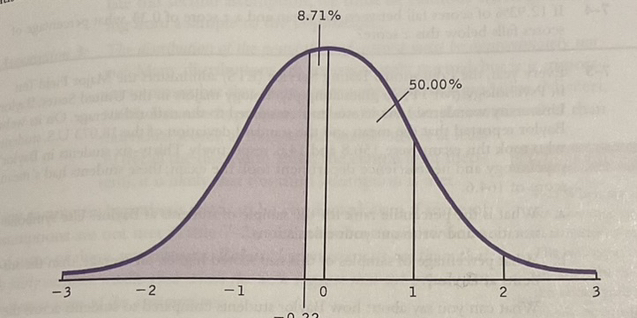
Visual representation: Draw the z-distribution curve, including:
Mean of the z-distribution at 0.
The calculated z-statistic is approximately -0.215 (rounded to -0.22).
Calculate the percentages:
The area below the z-statistic on the curve is shaded to represent percentages of interest.
The z-table identifies the percentage between the mean and the z-score of -0.22 as 8.71%.
To find the percentile rank:
Combine: 50% - 8.71% = 41.29%
Indicates that the average IAT score for the neurodivergent sample is significantly lower than the general population score of -0.14.
Conclusion on Hypothesis Testing
A hypothesis test is necessary to determine whether the neurodivergent sample scores differ statistically from those of the general population.
Upcoming sections will cover:
Assumptions required for conducting hypothesis tests.
Six steps are involved in hypothesis testing with the z-distribution.
Guidelines on whether to reject or not reject the null hypothesis.
Application of the Z table
The z-table can be utilized for both individual scores and sample means:
The key distinction lies in using the mean and standard error of the distribution of means instead of individual scores.
The example shows that a z-score of -0.22 corresponds to a percentage of 8.71% when comparedto the mean, providing important insights into behavioral perceptions within the assessed group.