Philip's Curve
It shows the inverse relationship between inflation and unemployment, suggesting that when inflation rises, unemployment tends to fall, and vice versa.
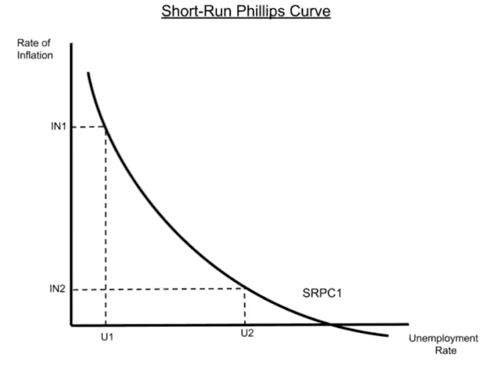
When inflation is high, wages go down because of less purchasing power.
When inflation low, each dollar has more value, so more people are going to hold on to it more.
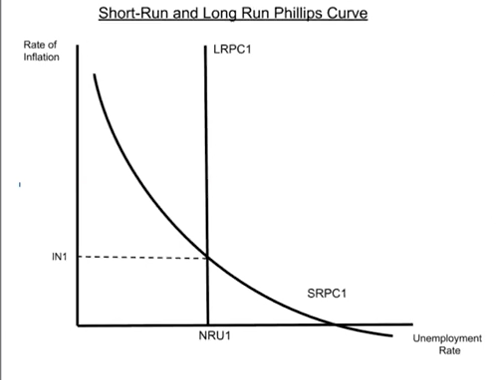
Long-Run Philip’s Curve
It shows the natural rate of unemployment (full employment)
Equilibrium is reached when SRPC intersects LRPC.
Inflationary and Recessionary Gaps
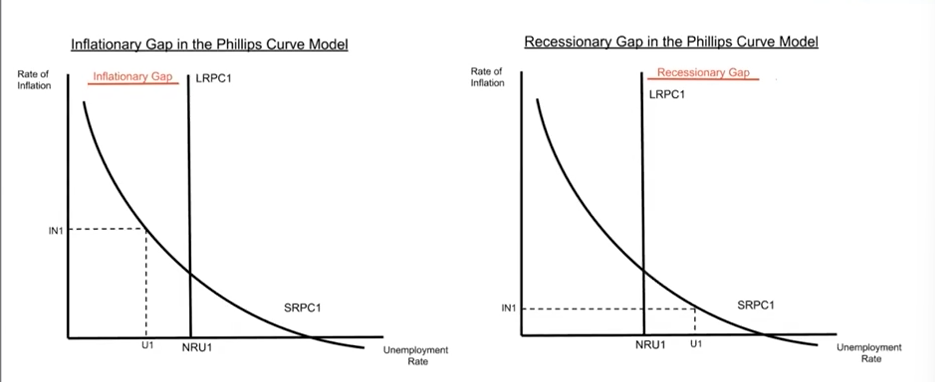
Inflationary Gap is to the left of LRPC, and recessionary gap is right of LRPC
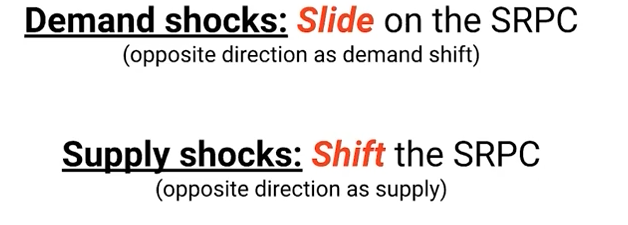
Demand Shocks & PC
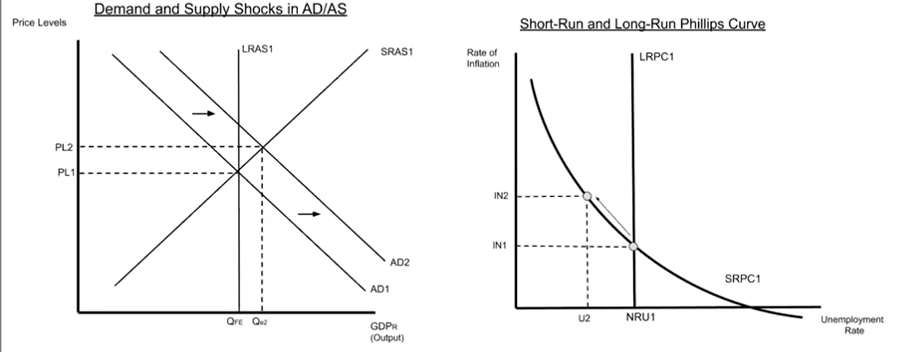
Supply Shocks
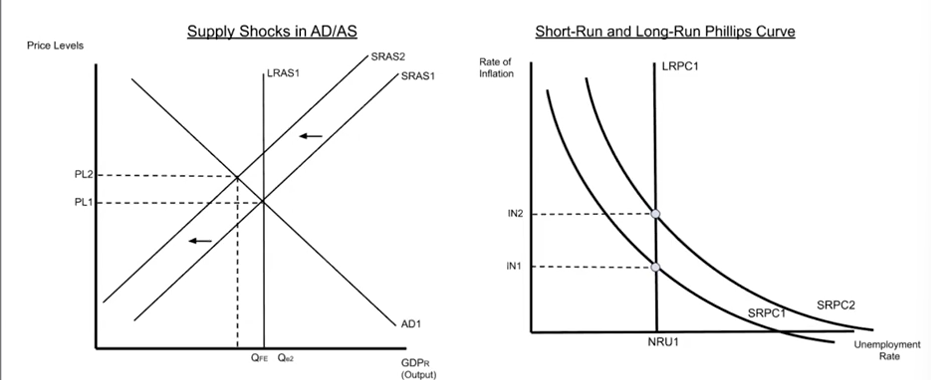
With supply shocks, the point on the curve will not move, rather the whole curve moves
Contrary to the ADAS curve shifting to the left, the PC curve will shift to the right, because a leftward shift in the ADAS curve causes price level to rise, thus inflation would increase
LR Impacts and Corrections
In an inflationary gap, the SRAS curve will shift left, and the SRPC curve will shift to the right, to reestablish equilibrium and increase inflation a bit more.
Shifters of LRPC
Decreasing structural and/or frictional unemployment will decrease LRPC, through more qualified workforce (structural), and improved job matching processes (frictional), thereby leading to a lower long-run unemployment rate, which shifts the curve to the left.
increasing structural and/or frictional unemployment will increase LRPC