Chapter 49: Venn Diagrams and Notation
Venn Diagram
- You can use a venn diagram to show frequencies in a probability question
- This venn diagram shows the results when 50 people were asked whether they owned a dog or a cat
- The rectangle represents everyone who was surveyed
- The number in each section tells you how many people that section represents
- Some people owned a dog and a cat so the ovals overlap
- The overlap can be represented by D n C
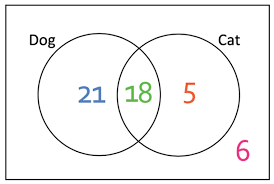
- 21+18+5 = 44 people owned a dog or a cat, you can write this as D u C
Set notation
- In maths a set is a collection of members or elements
- The elements in a set could be numbers, words or letters
- You can define a set in two different ways
- Listing the elements
- Using a rule
Set symbols to learn
- U means union. The union of two sets is the set of elements that belong to either set
- N means intersection. The intersection of two sets is the set of elements that belong to both sides
- e means the universal set. It represents all the elements you are allowed to consider in a question
- A means not A or the complement of A. It is everything in e but not in A
Working it out
- Start by labelling two circles to represent the two sets
- The write the x that are in both sets in the intersection of th two circles
- Carry on filling in the venn diagram, and remember to write any leftover members outside the circles