Huge - U2 Review
Basics
population distribution: where people live, locations on the earth’s surface
2/3 world population live in (top places people live in):
south asia
east asia
southeast asia
europe
north america, (eastern)
Demography
^ study of population characteristics (such as age, gender, occupation, fertility rate, health)
ecumene: portion of earth’s surface that is occupied permanently by human settlement
people usually are 90% of ppl are north of the equator, like good climate, close to sea level, and 2/3 of people live 300 miles from the ocean
also like living near the coast/urban - cities
ex. yellow river banks (?)
Factors that Affect Distribution
Environmentally
carrying capacity: max number of people land can withstand, sustain, hold without harming the environment
high pop. density = too many people concentrated in one are can destruct environment
(pressure, lack of water and food, arable, bad agriculture, too much waste)
Socially, Economically, Politically
social services and infrastructure are affected by density (how many people live in a certain area); water, jobs, houses
ex. cary, lots of people live here = increase of services like schools
we measure population by looking at the density, how many people live there
Types of Density
how we measure population
arithmetic: total number of people DIVIDED by land area = shows how many people live per square mile, etc.
physiological: total number of people DIVIDED by farmable land
higher = greater pressure people put on land to produce food (less farmable land)
how much farmland an area has
agriculture density: total number of farmers compared to land suitable for agriculture = shows how much farmers we have, technology advancement
USA has 2 farmers per km while China has 145
How to Measure Population Change
Crude Birth Rate (CBR): live birth rates per year after 1k ppl alive in the society
if rate is 10, there are 10 new babies per 1k
Crude Death Rate (CDR): live death rate per year every 1k ppl alive in society
South Africa
Natural Increase Rate (NIR): percentage that population grows in a year
formula: CBR - CDR/10
Total Fertility Rate (TFR): average number of children woman will have during childbearing years
replacement level fertility rate = 2.1; helps keep the population the same and where it is currently, to replace mother and father
middle east and africa have high replacement rates, while other countries are very low
africa is an example for all of the rates above
doubling rate: the time it takes to double population
divide 70 by birth rate
Infant Mortality Rate (IMR): annual number of deaths of infants under 1 years old (compared to total live births)
life expectancy: years newborns/people can expect to live for at current morbidity levels/conditions
dependency ratio: population of people under 15 or over age of 65
ages that need assistance, and people that are in working age
Reasons for Different population Rates in Different Places
public policies: certain rules or encouragements that the gov. gives to citizens to regulate population to a certain amount (the way the want it)
economic development (developed or developing?)
education
gender empowerment
healthcare conditions
cultural and traditions (what is culturally accepted?)
Population Pyramid
population pyramid: graph that shows distribution of different age groups (by 5) and sex ratio of a region
shows population projections, what direction the population will go in with time, in the future, predictions
tells country wealth
developing countries = wider bases, younger people (because of more babies, and small life span)
developed countries = are wealthier, have uniform (equal) shaped pyramids (because of less babies and a longer life span)
opposite stats (in rates, such as CBR)
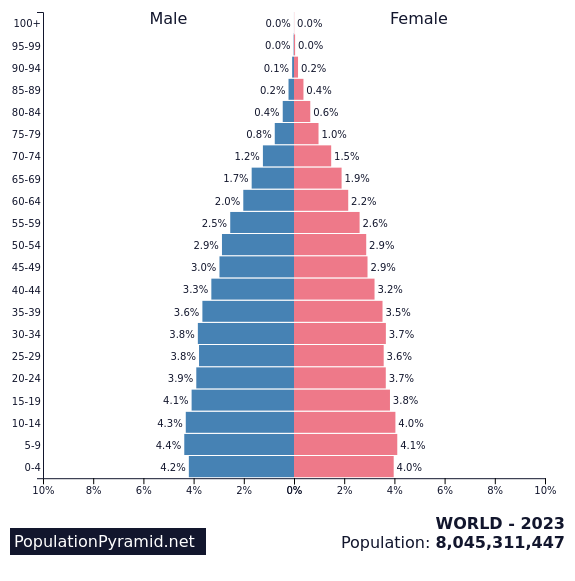
sex ratio may be unbalanced because of job opportunities
Theories
Malthusian Theory
we are becoming overpopulated
Thomas Malthus
was in and experienced industrial revolution
acknowledged that:
population will outpace food production. population increases geometrically while food increase arithmetically
food shortage and famine
criticisms:
slowed: contraceptives, education, women empowerment
advanced farming
advanced technology
false
birth rates are declining because of gov. policies, education, contraceptives, women empowerment
Esther Boserup (opposite)
agriculture
population increase = they will solve the issue with technology.
Neo-Malthusians
concerned about sustainability
focus on earth’s resources (limited)
we have food, but not distributed properly, focus on developing countries
we waste our resources, do not use them wisely
Government Policies
expansive: seek to increase population, more babies
soviet union, denmark, sweden
pro natalist
restrictives: see to decrease population, less babies
China and India, kenya sometimes
anti natalist
eugenic: favors one racial or cultural sector of population
nazi
japan
DTM: Demographic Transition Model
analyze and predict trends in population
births, deaths, natural increase rates
to see how country progresses from pre to post industrial
Stage 1
lots of farming, agriculture = economy
poor diet/famine
lack healthcare
lack water
lack education
not enough housing
plague, disease = high death rate, not good tech
lots of births, not guaranteed to live
lots of young people
youth dependent
before industrial revolution
no current examples
nomads? tribes?
population: 8k - 10k
Stage 2
natural increase is rapid
population boom
same high birth rate, high
deaths are falling rapidly, people are starting to survive
better nutrition and sanitation
medicine and vaccines
agricultural, not that much industry
agriculture revolution, better tech
sewers
england becomes overpopulation
industrialization start
moving to colonies
industrialization starts (near the end)
ex. pakistan, afghanistan, sub saharan africa, guatemala
population: 21k
Stage 3
slowing birth rate
children cost $$$
contraceptives
slower fall of death rate
people are older and living longer
access to meds
food preservation
urbanization, people moving to the cities
start of industrialization
mechanization, more machines less workers
no need for child labor
homes
women are working, higher education
natural increase is slower
population: 37k
ex. turkey, mexico, indonesia, india, russia, brazil
south east asia
Stage 4
birth rate is the same
death rate low
natural increase slows and straightens
elderly dependency
highly industrialized; post-industrialization
service jobs
working women; family planning
some do not have children
population: 40k
ex. more developed countries; north america, japan, west europe, england
Stage 5
contested, people don’t believe this stage exists
very low birth rate
low death rate
elderly dependent
replacement rate: way below
zpg: zero population growth
medically advanced
people living much longer
population: 42k
ex. japan and germany
ETM: Empidemiological Transition model
predictable stats of country while developing
sicknesses/diseases
life expectancy
what the cause of the death rate is
Stage 1
infectious disease
high death rate, no meds or vaccines n
cholera (waterborn, no cure);epidemic
bubonic plague
tuberculosis
pandemics and epidemics
animal attacks and accidents
malnutrition
poor diet and nutrition
Stage 2
receting diseases and pandemics are decreasing
industrial revolution: vaccines such as penicillin
sanitation improved
nutrition improved
agricultural revolution; growing more crops
Stage 3
degenerative and human made diseases
caused by human choices
diabetes start
cancer start
stress level rise = heart attacks
people living longer and lifestyle choices
stage 4
delaying cdr, getting rid of diseases due to advanced meds; allows them to living longer
heart diseases, strokes,
alzheimer’s and dementia because of longer life expectancy
stage 5
covid
re-emergence of infectious disease
bacteria
not taking antibiotics
new diseases
Migration
permanent or semi-permanent relocation of people from one place to another
immigration: coming into country
emigration: from a location, leaving
net migration: number value difference between emmigrants and immigrants
Types
international: permanent movement from one country to another, crossing border
forced: moving due to fears of violence/survival
voluntary: moving due to their own choices (job)
national or internal migration: moving within country
interregional: moving from one region of country to another (rural to urban)
intraregional: movement within region
Human movement
cyclic: quick non permanent migration, repeated / daily
driving to school and back, going to work
periodic: intermittent but recurrent movement
geese moving during a season but moving back
migration: one place to another, permanent or semi
person from out of country moving back
rural or urban: temporary or permanent
china moving to major cities from rural
city from rural
transhumance: swanson non permanent, winter and summers
herders moving livestock to higher altitudes
Voluntary migration
voluntary: moving by choice
step migration: stages of moving, cannot go to final destination in one go, immediately.
stop place by place for a few years
brain drain: shortage of labor caused by people leaving country
better for u.s. because of talents and smarts from other countries
countries of origin is lacking, because of people being taken away
brain gain: positive for country that has high immigration
remittances: money that is sent back to families of origin (from migrants
balikbayan box
^ Laws
ernst ravenstein
migration flow generates a return or counter migration
exchange
majority of migrants move a short distance
migrants who move long distances choose big cities
urban residents are less migratory than in rural
families are less likely to make international moves than young adults
Push Factors - speed
reason why people move
poverty, persecution
environmental
natural disasters
economic:
great depression, find new jobs
political
gov. restrictions, ex. Jews
Ukraine
Pull Factors - speed
attracting migrants
social
move for jobs and education
religious freedom
quakers
because of discrimination
environment
visually pleasing places
political
free healthcare
no world conflict
social
moving to big ciites
environment
gold rush
political
moving to seek better living
chain migration: chain reaction
when person of country moves to u.s.
cultural clusters
telling people or origin about place you moved to positive things - they move
gravity model: measuring interaction of two cities
influences
ranked places migrants are attracted to
Migration Flows
global: moving from one country to anothe r
re
philippines to dubai: housekeeper
visa
have opportunities that stop person from moving to their next location
job opportunities
sometimes have things that block them from going to their final destination
missing family
language barrier
Refugee
refugees come from middle east and africa
war
fear their lives
Effects of Migration
chain migration and ethnic neighborhoods:
when you report to family about how good the place you moved to is, and they all start to move here creating an ethnic neighborhood
also called a cultural cluster
step migration: moving in shorter distances but having one final destination
intervening opportunity: when something positive stops a person from reaching a final destination
one of the “steps” you take
migrants can change political laws, can make new ones to reflect their beliefs.
economically: costly when refugees come in
Sudan ***
separated into a south sudan
north: arabs and muslims
south: christians
lost boys of sudan: targeted
refugee crisis
come from middle east and sub saharan africa because of colonization
ethiopia to kenya
only 12k out of 27k people made it to kenya from ethiopia
another civil war in south sudan
the lost boys
effects immigrants have:
population size?
society/religion?
culutral landscape?
economics and jobs?
laws?
Syria ****
people moving to western europe because of civil war
people fear that their culture is going to be “taken over” because of low replacement rates
Economic Effects
receiving countrie
immigrants = good for labor, (of less desirable and low paying work)
reduces jobs” even though americans don’t want to work that job
open up cultural businesses, stimulated economy
countries of origin
remittances: giving back money to play of origin afte rmovign out of country
brain drain
less strain on resources
decrease in unemployment
(positives) for the “new country”
social:
bring culture with them
some people dislike this, discriminatory
demographic:
low growth or 0 growth (4-5 stage)
need immigrants (main source of rise of population)
are working age, reduce dependency ratios
country of origin
demographic: young and elderly are left behind, as well as the women
makes a unbalanced sex ratio
politically:
restrictions: xenophobia, limiting cultural diversity
encourage: guest workers, family reunification
easier to move back than then now, costs
immigration to u.s.
quotas: max limit of people who can immigrate to a country
largest number of immigrants
Waves
colonial period: colonization, western european countries settling in “new world” aka u.s.
17-18th centuries
majority coming in are indentured servants and enslaved africans
mid-nineteenth century: north europe, scotland, ireland sweden, scandinavian
rate naturally increased after 1820
1836 - 1914
dangerous voyage
first immigration law in 1875
turn of 20th century: southern and eastern europe
emergency quota act (1921), and immigration act of 1924
restricting s and e europeans, jews, italians and slavs (increased in 1890.s)
ww2 refugees denied entry
1945 - present: latin america and asia (china and india)
decline or european immigrants
immigration increased (mexico and central america)
migrants come from hispanic populations and work in physical jobs, low skilled (31% of u.s. population)
U.S. Migration Trends
1900-1960’s = people leaving south and moving north for job opportunities
currently moving from north to south, sunbelt
mid 1900’s = urban to suburbs/rural
now = rural to urban, return to cities
offloading population from coastal areas inland
encouraging economic development in interior, inland since there are more settlements at coasts
International Migration Trends
south to north hemisphere (90% live in north)
poor → rich regions
tension → peaceful regions
rural → urban regions