Research Methods
Experiments
Lab
- Controlled setting like a laboratory
- Participants can be randomly allocated to conditions
:) Easy to control extraneous variables, high internal validity
:( Artificial environment so low ecological validity
:( Demand characteristics are more likely
Field
- Natural environment
- Participants can be randomly allocated to conditions
:) Natural environment so high ecological validity
:) Less control over extraneous variables so low internal validity
Natural
- Can be in a controlled or natural setting
- IV is an event that cannot be controlled by the researcher
- Used when manipulating the IV would be unethical or not practical
:) Can study IVs that they wouldn’t be able to study otherwise
:( As the experimenter cannot control the IV, they cannot establish a cause and effect relationship
:( Lack of control over extraneous and confounding variables, reduces internal validity
Quasi
- Can be in a controlled or natural setting
- IV is a variable that occurs naturally in the population so cannot be controlled by the researcher
:) As the IV is natural, any changes in the DV are less likely to be artificial
:( Cannot randomly allocate to control participant variables, may affect validity
Observational techniques
Naturalistic
- Real-world location where the behaviour being studied takes place
:) High ecological validity
:( Low control over extraneous variables
Controlled
- Lab conditions, often involve researcher setting up a condition for participants to interact with
:) High control over extraneous variables
:( Low ecological validity
Overt
- Participants are aware they are being observed
:) Informed consent
:( Low ecological validity
Covert
- Participants are not aware they are being observed
:) High ecological validity
:) Less chance of social desirability bias or investigator effects
:( No informed consent
Participant
- Researcher becomes part of the group
- Can be overt or covert
:) More insight and understanding into participants’ behaviour
:( Difficult to record data when among the people and cannot make notes
:( More chance of investigator effects
Non-participant
- Researcher watches from outside the group
- Can be overt or covert
:( May miss parts of the experience
Self-report techniques
Interviews
- Conversation between researcher or participant
- Can be done in person or over the phone
- Interviewer asks questions and records data
- Structured interview- questions decided in advance, schedule of questions stays the same
- Best when comparing participants
- :) Likely to be more reliable because participants are asked the same questions
- Unstructured interview- researcher can deviate from questions and follow up on answers, which may take the interview in a different direction
- Best when research is exploratory and requires depth
- :) Can get more detailed information
- Leading questions should be avoided
:) Can get detailed data that allows a meaningful exploration
:( Time-consuming- participants will usually be interviewed individually, likely to have a small sample size and low generalisability
:( Social desirability bias
:( Investigator effects
Questionnaires
- Paper-based or online questions that the participant gives a written answer to
- Open questions- does not limit answers, allows participant to answer in any way they choose
- Qualitative data
- :) Allows participant to express real feelings and give more detailed answers
- Closed questions- limits answers, participant choses from a set of answers like a scale or tick boxes
- Quantitative data
- :) Easier to count up and analyse
- :) Quick and easy for participants to answer
- Questions need to be carefully constructed to be clear and easy to understand
- Leading questions should be avoided
- Should not take too long or participants will lose interest
:) Quick and easy to gather large amounts of data
:( Social desirability bias
:( Participants may not understand the questions and they cannot be explained
Correlations
A relationship that may exist between two measured variables
Variables are called co-variables because they are not causally linked
Can be conducted on primary or secondary data
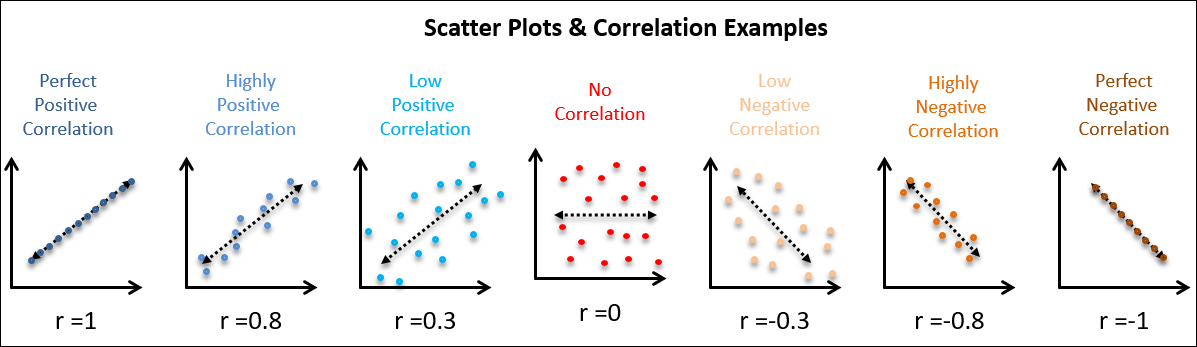
Positive correlation- as one variable increases, the other also increases
Negative correlation- as one variable increases, the other decreases
No correlation- no link between co-variables
Correlation co-efficient- a number between -1 and 1 that measures the strength of a correlation
- Closer to -1, stronger negative correlation
- Closer to 1, stronger positive correlation
- 0 means no correlation
:) Can be conducted quickly using secondary data
:( Cannot give info about cause and effect
:( May be unmeasured variables affecting the data that are not taken into account
Case studies and content analysis
Case studies
- Gather detailed info about a case, e.g. an individual, a specific group of people, or an event
- Use multiple methods to gather data, e.g. interviews and observations
- Data can be qualitative or quantitative, primary or secondary
:) Detailed data so more valid and in-depth conclusions
:( Time-consuming
:( Low sample size, not representative of wider population
Content analysis
- Indirect observation using existing communications, e.g. articles and programmes
- Systematic examination of material to determine meanings that underlie content
- Can be done by thematic analysis
:) Ethical- no people used to gather data
:) High ecological validity- analyses real interpretations
:( Relies on researcher’s interpretation, may be subjective
Thematic analysis
- Analytic technique used to summarise key ideas and identify patterns from qualitative data gathered by methods like interviews and case studies
- Researcher familiarises themselves with the material, finds categories/themes and creates codes for analysis
- Re-examine data and code it according to categories
- Review categories by checking against data
- Data summarised by categories and supported with data drawn from transcript like quotes from an interview
- Written up as data analysis
Aims and hypotheses
Aims
- Clear idea of what a study is investigating
- Written as a statement
Hypotheses
- Prediction of the likely outcome of the experiment
- Null- research starts with this, states that there will be no relationship
- Alternate- states that there will be a significant outcome of the research
- If conducting a study, called the experimental hypothesis
- Directional/one-tailed- states exactly what outcome is expected using comparative language
- Used when previous research predicts a likely direction of results
- Non-directional/two-tailed- states that there will be a difference between conditions but not what it will be
- Used when there is no previous research
Variables
- Independent- manipulated by researcher, makes a change to it in one or more conditions
- Dependent- changed by IV, measured by researcher
- Extraneous- any variables other than IV that could influence DV
- Participant variables- personal characteristics of the participant, like age or intelligence
- Controlled through randomisation and matching
- Situational variables- features of the external environment, like lighting or sound
- Investigator effects- characteristics of the researcher that influence the behaviour of participants and results
- Controlled through double-blind
- Confounding- an EV that has affected the DV
- Operationalising- defining variables and making them observable and measurable so that a cause and effect relationship can be seen
- Demand characteristics- participants are aware of the aims of the study and change their behaviour to either help or mess up the data
- Deception can help prevent, but would have to be ethically justified
Sampling techniques
- Target population- group of people who are being studied, usually impossible to test whole group so a sample is drawn to represent them
- Volunteer- people choose to respond to a request for participants, often through advertising
- Random- every member of the target population has an equal chance of being selected, can be done by picking names from a hat or using a computer program
- Opportunity- whoever happens to be available at the time where the study is happening
- Systematic- researcher picks people according to a system e.g. every fourth person
- Stratified- target population is broken down into key demographic components (strata) and participants are chosen from each strata according to its relative size in the population
| Representative | Effort | Bias | |
|---|---|---|---|
| Volunteer | :( Low | :) Low | :( High |
| Random | :) High | :( High | :) Low |
| Opportunity | :( Low | :) Low | :( High |
| Systematic | :) High | :( High | :) Low |
| Stratified | :) High | :( Very high | :) Low |
Experimental design and control
Independent groups
- Different groups do each condition, each participant only takes part in 1 condition
:) Less risk of demand characteristics
:( More risk of participant variables influencing results
Repeated measures
- One group does all conditions
:) No participant variables
:) Need fewer participants
:( More risk of demand characteristics
:( Results could be influenced by order effects (practice and fatigue)
Matched pairs
- Like independent groups but the groups are matched on key factors like intelligence or age
:) Reduces influence of participant variables
:( Impossible to control all participant variables
:( Time-consuming because researcher has to measure characteristics and pair participants
Control
- Counterbalancing- stops order effects, also known as ABBA designs- groups split into 2 smaller groups, half do condition A then B and half do B then A
- Standardisation- all participants experience the research process in the same way
- Makes EVs the same for all participants
- Random allocation- participants in an independent groups design are randomly allocated to conditions
- Randomisation- standardised procedures can cause problems if the order in which things are done could be an extraneous variable, researchers may randomise parts of the procedure to remove bias
Pilot study
- Small-scale test run of the experiment to check method will work
- Useful to check timings and instructions and to identify any problems
- Changes can be made to ensure that the real study runs smoothly
Non-Experimental Method
- Studies that do not have an IV or use the experimental designs
Single Variable Studies
- Not measuring a cause and effect relationship
- Just measuring one variable
Correlational Studies
- Researcher measures two variables and sees whether there is a relationship
- Positive correlation- as one increases, the other increases
- Negative correlation- as one increases, the other decreases
- Cannot establish a cause and effect relationship
- Can rule out causal relationships without having to conduct an experiment
:) Often cheaper and more practical than experiments
:) Less likely to be unethical than experiments
Case Studies
- Detailed investigation into a person or small group
- Usually done to investigate unusual and rare experiences
:) Can gather in-depth information into a person or experience
:) Way to study rare situations that cannot be investigated with experiments or correlations
:( Low number of participants so low population validity and generalisability
:( Cannot establish a cause and effect relationship
Observational design
- Behavioural categories- before starting the observation, the researcher decides what behaviour is relevant and sets up a tally chart to record it
- Different categories of target behaviour, researcher ticks when they see it happening
- Helps operationalise DV
- Event sampling- observer watches for target behaviours and records all instances
- :( Can be hard to do accurately when there is lots of info to record, reduces reliability
- Time sampling- observer watches and record occurrences of relevant behaviours at set time interval
- :( Possible to miss important events because they occur outside the time frame
- Researchers should check the tally works by doing a pilot observation
- Observers should be trained in advance to ensure they know what they are looking for and can reliably identify it
- Multiple observers should be used and inter-rater reliability should be tested (observers’ tallies match up)
:( Observer bias- observers may see what they want to see, can decrease internal validity
Ethics
Informed consent
- Participants should be aware of their involvement in research and if possible should know the full aim before taking part
- Need to formally agree to take part before the study begins
- Parents sign on behalf of children under 16 and next of kin sign on behalf of people who cannot consent for themselves
- If not possible, can be gained through other means:
- Presumptive consent- asking a similar group if they would consent
- Prior general consent- warning participants they will be deceived before they take part
- Retrospective consent- asked at the end when the true aim has been revealed to the participants, they can then choose if they want their data to be included
Deception
- Participants should be aware of all aims before they take part and should not be lied to during the research
- Can be deceived if justified by an ethics committee but must be fully addressed in debrief
Confidentiality
- Names and personal details of participants should be kept secret
- Can refer to participants by numbers and not using locations when discussing
Protection from harm
- Participants can be harmed if they are put under stress, embarrassed, frustrated, hurt or exposed to anything that changes their mental or physical state
- Participants should be under no more harm than they are in everyday life
Right to withdraw
- Participants should know they can leave at any time
- Can also withdraw data at the end of the study
Debriefing
- After the research, participants should be told everything about the study
- Given opportunity to ask any follow up questions
- Especially important if there has been any deception
Peer review
- Editor sends copies of research to several expert reviewers (peers), can be single blind (author is unaware who reviewers are), double blind (neither authors nor reviewers know who each other are) or open review (everyone knows who is involved)
- Reviewers independently read the paper and check for mistakes and issues of fraud, then report back to editor for comments and suggestions
- Editor decides whether to accept and publish, accept if the author makes small revisions, reject but suggest revisions and then resubmission, or reject outright
:) Acts as a barrier to stop flawed, fraudulent and bad research becoming part of the public understanding of psychology
:( Reviewers may be biased e.g. having an interest in promoting or suppressing studies that agree or disagree with their own research
:( Some bad research still gets through, the system is not perfect
Implications of psychological research for the economy
Clinical
- Dealing with mental health issues
- 2013- mental health issues cost the UK economy £70-100 billion each year
- Cost of care for sufferers, lost economic activity due to days off work and underperformance
- Psychologists work to understand causes of disorders and develop treatments
- Drug treatments, talking cures, CBT
- Allowed people to continue living independently and staying in the community
Occupational
- Made changes to the workplace
- Stress management programmes designed to reduce days lost through illness
- Research into biorhythms has led to changes in way shift patterns are organised, increases productivity and reduces time off work
- Managing HR, e.g. developing effective recruitment strategies that ensure beneficial people are employed
Health
- Behaviour changes that will lead to improved health and less demand for health services
- Treating addiction, running health promotion campaigns
Developmental
- Research by Bowlby and others highlighted the importance of early childhood experience in the development of the child
- Introduced parental leave and developed new working practices for parents, encouraging them to form strong emotional bonds with their children
- Changed how children without parents are treated, encouraging early adoption and changing how institutions operate
- Children grow up to be psychologically healthy and independent adults who contribute to the economy
Validity and reliability
Validity
- Extent to which the research measures and tests what it claims to
- Internal- extent to which results are due to tested variable, not EVs and CVs
- Can be improved by controlling EVs better and ensuring high reliability in procedure and measurement
- External- extent to which results of the study can be generalised to other people (population), other settings (ecological) and across time (temporal)
- Can be improved by developing realistic tests and using natural settings
- Assessing validity
- Face validity- look at the test to see if it is testing what it claims
- Concurrent validity- uses already validated measures for the DV, correlates the measures from one test with measures using another
- Predictive validity- assessing how well it predicts future behaviour
- Temporal validity- compares results over time by retesting
Reliability
- Extent to which research is consistent, if it is repeated in the same way and the findings are the same
- Can be reduced if there are extraneous variables or if the test itself is unreliable
- Internal- consistency within the experiment
- Improved by standardisation
- External- consistency over time
- Improved by increasing objectivity, like operationalised variables
- Assessing reliability
- Test-retest method- measures external, give test to same participants on multiple occasions and correlate results, reliable if results are the same
- Inter-rater reliability- measures internal, multiple observers independently record the data and their records are correlated, reliable if they agree
- Split-half method- measures internal for tests/questionnaires, participants complete a test that is divided into two halves which are scored separately, reliable if the scores for each half are the same
Features of science
- Scientific method- acquiring knowledge through observation, measurement and experiment
- Observation of phenomenon leads to theories that explain it
- Hypotheses based on theories are tested using empirical methods
- Theories reviewed in light of evidence
- Empirical methods- data-collecting techniques based on evidence rather than theories
- Have to test with direct observation
- Objectivity- data and interpretation are unbiased, needed for research to be considered scientific
- Replicability- research must be repeated exactly to test reliability, researchers replicate procedure and test it to see if same results occur
- Theory construction- initially, theories seek to explain observed phenomena (induction), then enable predictions (hypotheses) which are tested and the results are used to refine the theory (deduction)
- Must be falsifiable
- Has to be backed up with repeated use of the scientific method
- Falsifiability- theories should generate testable predictions which can be proven wrong, means process used to test hypothesis and data must be objective and exist in a way that can be tested
- Hypothesis testing- empirical tests yield objective data that allows a hypothesis to be accepted or rejected, provides evidence to help judge a theory as valid or not
- Paradigm- a shared set of assumptions about the content and methods of a particular discipline
- Paradigm shift- dominant paradigm is replaced with a new one
Report writing
- Abstract- briefly summarises the research so other researchers can quickly decide if it is relevant without having to read the full report, includes aim, theoretical background, method, results and conclusions
- At the beginning of the report but written last
- Introduction- outlines why the study was done, discusses the theoretical perspective being tested, a summary of research already done on the topic, and outlines the aims and hypothesis
- Method- details exactly what was done in the experiment
- Method- design decisions, variables
- Participants- sampling method, sample size and breakdown, allocation to conditions if relevant
- Apparatus- any equipment needed
- Standardised procedure- step-by-step instructions, including when and where the study happened and instructions to the participants
- Controls- details of how issues of bias were dealt with
- Results- summarises data in tables and charts, supported by written descriptions of the conclusions drawn from the data and findings of any inferential tests used
- Discussion- links findings and conclusions to background theory and research, explores limitations and suggests improvements, and outlines implications and applications of the findings and suggests ideas for future research
- References- list of all the references cited in the rest of the report, usually done in Harvard format and includes journals, books and websites
- Allows others to check the sources for accuracy
Types of data
Primary
- Gathered by the researcher first hand to answer their specific research question
- Involves designing a study, piloting it, getting a sample, collecting data and analysing
:) Likely to be more reliable and valid due to high levels of control available
:( Costs a lot of time and effort
Secondary
- Already been gathered for other research purposes
- Relevant data is identified and analysed in a way that enables the researcher to draw relevant conclusions
- Used in meta-analyses
:) Costs less time and effort
:( May be less valid and reliable
Qualitative
- Words and descriptions
- Collected with self-report techniques that use open questions
- Behaviour not usually measured, just explored with an attempt to interpret and understand its meaning, providing a deeper insight into thoughts and feelings
- Can be converted to quantitative data
:) Likely to be more in-depth
:( Time-consuming to gather and analyse
Quantitative
- Numerical
- Any data that can be converted into a count
- Collected with experiments, correlations, observations and self-report techniques that use closed questions
- Comparisons can be made by analysing the dataset using appropriate descriptive statistics and graphical representations
- Can be used in inferential tests to determine significance
- Regarded as more scientific and objective than quantitative data
:) Easy to analyse and compare
:( Likely to only give superficial measures
Descriptive statistics
Central tendency
- Mean- add all data items together and divide by the number of items
- Median- rank all data items from smallest to largest in size and pick the middle value
- If an even number of values, add two middle together and divide by 2
- Mode- most frequently occurring data item
| Strength | Weakness | |
|---|---|---|
| Mean | Likely to be most representative as all scores used | Can be affected by extremes, cannot be used on nominal data |
| Median | Unaffected by extremes | Less representative than mean, does not use all scores |
| Mode | Unaffected by extremes | Does not use all scores |
Dispersion
- Range- subtracting smallest value from biggest, higher range = more variability
- Standard deviation- spread of data around mean and allows you to see relationship between scores
| Strength | Weakness | |
|---|---|---|
| Range | Shows overall spread of whole dataset | May not be representative if biggest and smallest values are extremes |
| Standard deviation | Representative as all scores usedShows how individual scores relate to each other and the mean | Harder to calculate |
Displaying data
Tables
- Contain descriptive statistics such as measures of central tendency and dispersions
- All columns and rows need to be labelled
Scattergrams
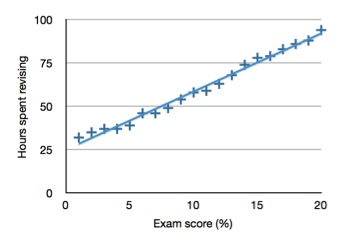
- Only used to display correlational data
- Show the direction and strength of the correlation
Bar charts
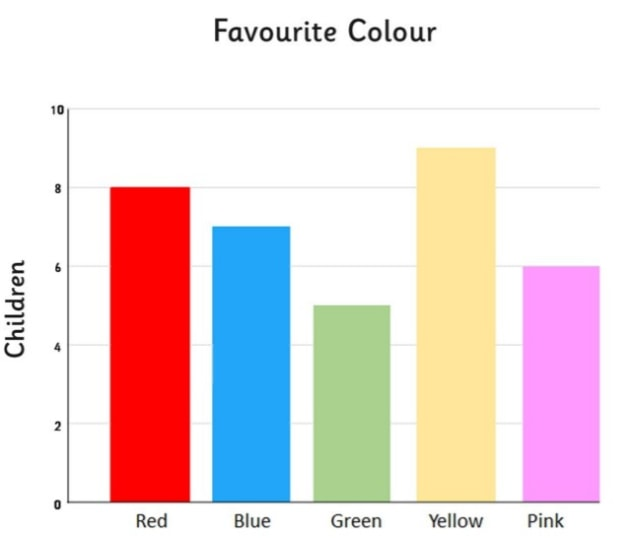
- Consist of categorical data for comparison
- Categories go on x-axis and frequency goes on the y-axis
- Bars do not touch as the data is discrete
Histograms
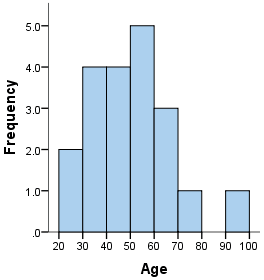
- Used when the x-axis shows continuous data
- The y-axis shows the frequency of occurrence of the data
Other
- Pie charts- show frequency of categories as percentages
- Frequency polygons- similar to histograms (continuous data along x-axis) but can show frequency of scores for 2 or more variables
Distributions
Normal
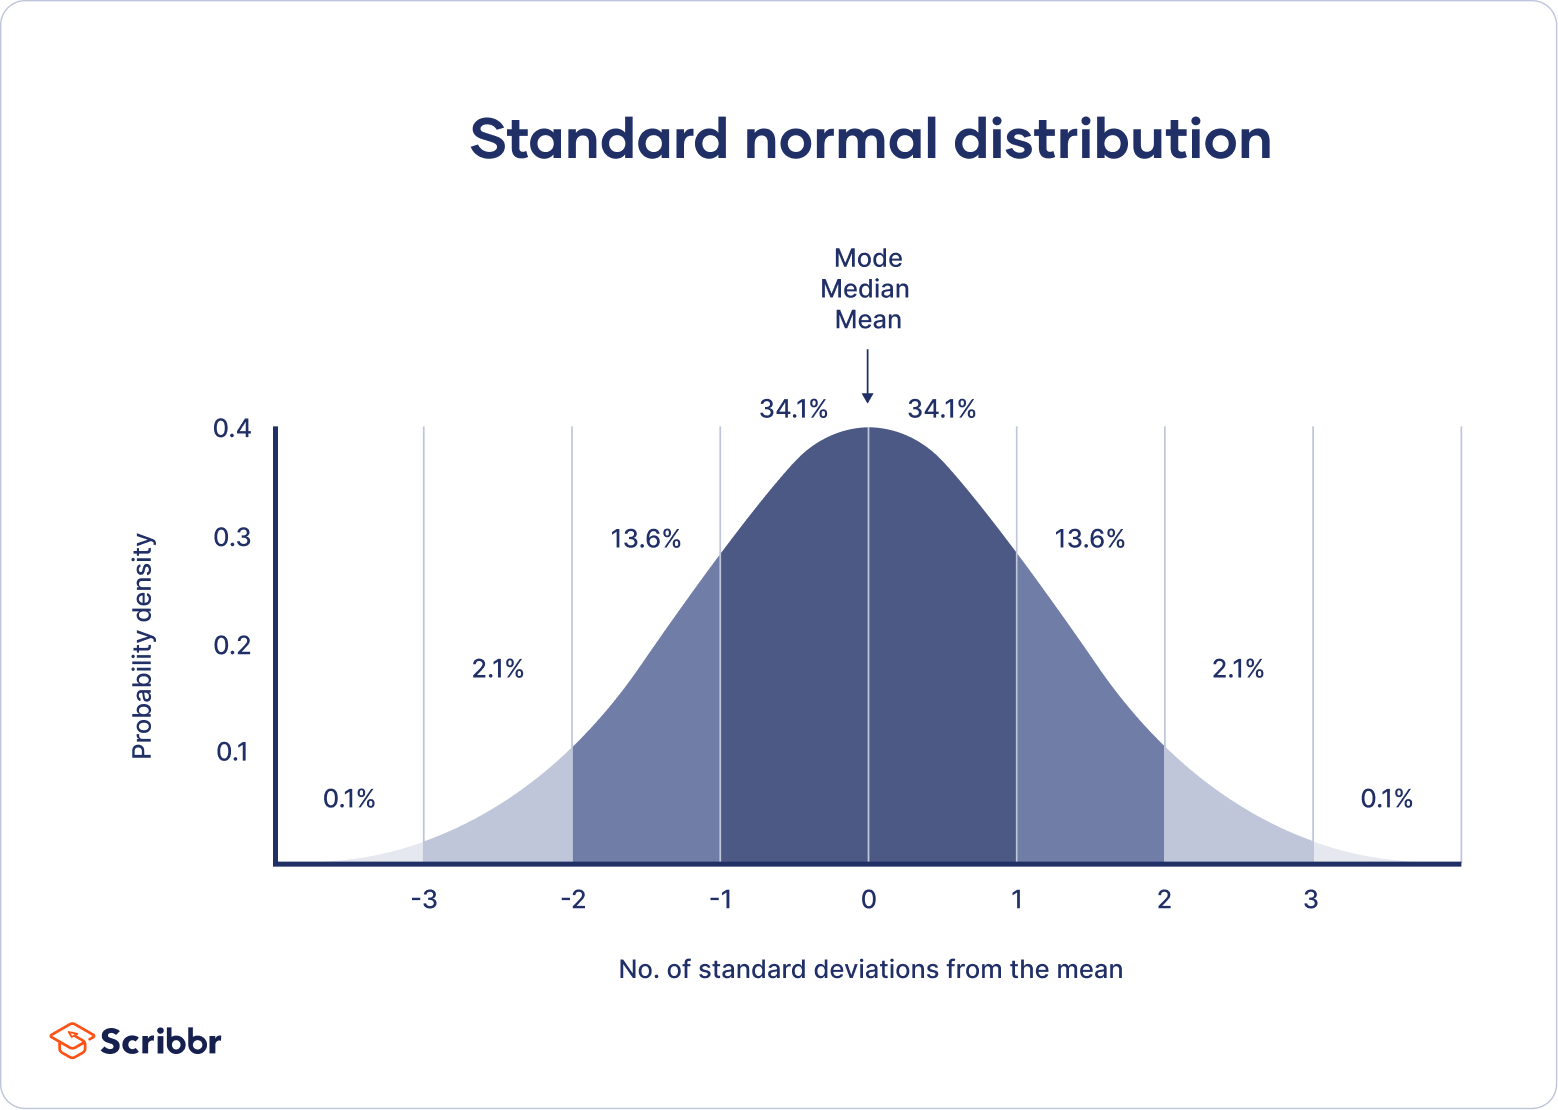
- Mean, median and mode are at the same point
- Data is symmetrical around the mean
- Bell-shaped curve
- If a score falls 3 or more standard deviations away from the mean, only a tiny percentage of the population will have that score
Skewed
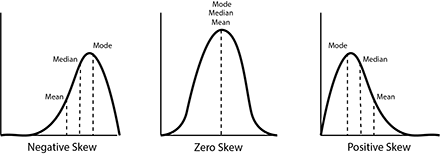
- Scores are not distributed equally on either side of the mean
- Negative skew- scores are mainly above the mean, more scores on the right
- Positive skew- scores are mainly below the mean, more scores on the left
- More common when only a few measures have been taken
Levels of measurement
Nominal data
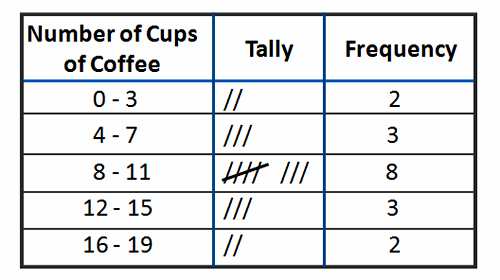
- Frequency data
- Gathered by counting frequency of occurrence of the target behaviour
- Discrete- not on a scale of measurement
- Most simple, limited calculations can be made using it
- Analysis can be limited and superficial- cannot use measures of central tendency, can use percentages and proportions
- Sign test or chi-squared test
Ordinal data
- Continuous- represents scores along a scale
- Allows ranking along the scale
- More complex analysis, can use measures of central tendency and dispersion
- Mann-Whitney test or Wilcoxon test
Interval data
- Also continuous, but scale of measurement features exact and equal intervals between points on scale
- Each point on scale represents equal quantities of the measured variable
- Suitable for all types of calculation
- T-tests or Pearson’s r test
Inferential testing
- In order to accept results are generalisable, you have to assess the probability that they occurred by chance factors rather than a genuine effect
- Need to know direction of the hypothesis, number of scores (n) and probability level needed
- Standard probability (p) level is 5%
- If p that results happened by chance is 5% or below, accept there is a genuine effect
- If p is over 5%, have to say it is too risky and accept null hypothesis
- Type 1 error- rejection of the null hypothesis when results were actually due to chance
- More likely if significance level is too high, e.g. at 10%
- Type 2 error- acceptance of the null hypothesis when results were actually real
- More likely if significance level is too low, e.g. at 1%
- Gather data and put it through the appropriate test for the observed value
- Using info on design and hypotheses, find critical value table appropriate to the study
- Compare observed value from test to the critical value on the table and decide whether results are significant or not
Sign test
- Simplest inferential test
- Nominal variables, repeated measures design
- For each participant, subtract scores on measure 1 from measure 2
- Add a + or - sign to indicate the direction of the difference and omit data where there is no difference
- Count the number of the least frequently occurring signs, this is the observed value (s)
| Repeated measures | Independent measures | Correlation | |
|---|---|---|---|
| Nominal | Sign test | Chi-squared | Not possible |
| Ordinal | Wilcoxon | Mann-Whitney | Spearman’s rho |
| Interval | Related t-test | Independent t-test | Pearson’s r |
For a chi-squared test, you need the degrees of freedom based on the contingency table