Half-life
Radioactivity is a totally random process
- Radioactive substances give out radiation from the nuclei of their atoms-no matter what
- This radiation can be measured with a Geiger-Muller tube and counter, which records the count-rate-the number of radiation counts reaching it per second
- Radioactive decay is entirely random. So you can’t predict exactly which nucleus in a sample will decay next, or when any one of them will decay
- But you can find out the time it takes for the amount of radiation emitted by a source to halve, this is known as the half-life. It can be used to make predictions about radioactive sources, even though their decays are random
- Half-life can be used to find the rate at which a source decays-its ACTIVITY. Activity is measured in becquerels, Bq
The radioactivity of a source decreases over time
- Each time a radioactive nucleus decays to become a stable nucleus, the activity as a whole will decrease
- For some isotopes it takes just a few hours before nearly all the unstable nuclei have decayed, whilst others last for millions of years
- The problem with trying to measure this is that the activity never reaches zero, which is why we have to use the idea of half-life to measure how quickly the activity drops off
- The half-life is the time taken for the number of radioactive nuclei in an isotope to halve
- It is also the time taken for the activity, and so count-rate, to halve. A short half-life means the activity falls quickly, because the nuclei are very unstable and rapidly decay. Sources with a short half-life are dangerous because of the high amount of radiation they emit at the start, but they quickly become safe
- A long half-life means the activity falls more slowly because most of the nuclei don’t decay for a long time-the source just sits there, releasing small amounts of radiation for a long time. This can be dangerous because nearby areas are exposed to radiation for millions of years
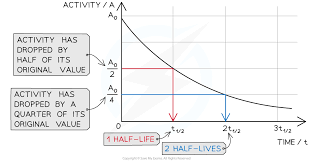
You can measure half-life using a graph
- If you plot a graph of activity against time, it will always be shaped like the one to the right
- The half-life is found from the graph by finding the time interval on the bottom axis corresponding to a halving of the activity on the vertical axis