ch04 Continuous Random Variables & Prob Distributions-6
Chapter 4 Continuous Random Variables & Probability Distributions
4.1 Probability Distributions and Probability Density Functions
Continuous Random Variables: Variables that can take on an infinite number of values within a given range.
Probability Density Function (PDF): A function that describes the likelihood of a continuous random variable taking on a specific value. The area under the curve within a certain interval represents the probability that the variable falls within that interval.
4.2 Cumulative Distribution Functions (CDF)
Cumulative Distribution Function: A function that describes the probability that a random variable is less than or equal to a certain value.
Calculated as the integral of the PDF.
4.3 Mean and Variance of a Continuous Random Variable
Mean (Expected Value): Represents the average value of the random variable; for a continuous variable given by the integral of x multiplied by the PDF over its range.
Variance: Represents the spread or dispersion of the random variable; calculated as the integral of (x - mean)² multiplied by the PDF over its range.
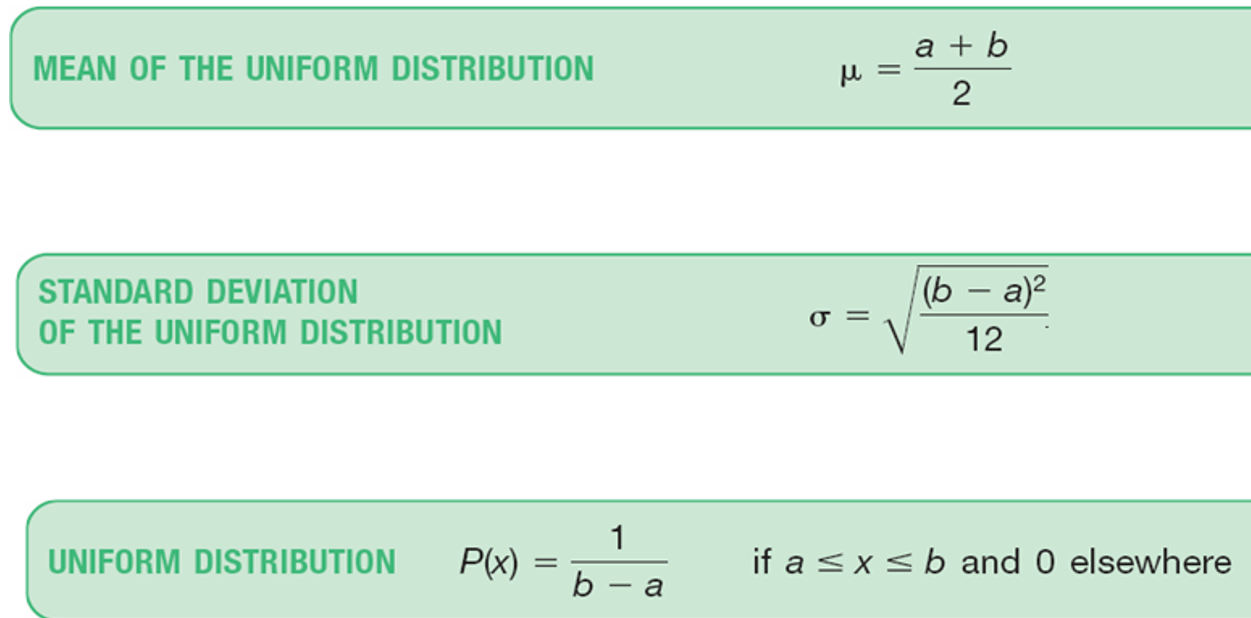
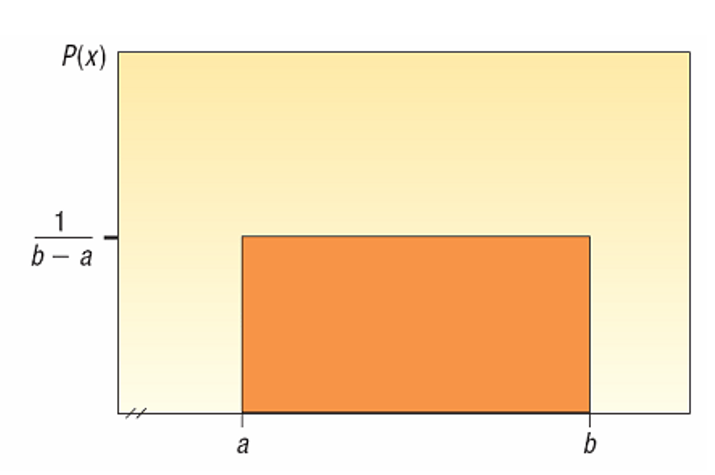
4.4 Continuous Uniform Distribution
Definition: A simple distribution where all outcomes are equally likely within a defined range [a, b]. The shape of the distribution is rectangular.
Example: Waiting Time at a Bus Stop
Scenario: Bus arrives every 30 minutes (from 0 to 30 minutes).
Typical Wait Time: Mean waiting time calculated as ( \frac{0 + 30}{2} = 15 ) minutes.
Standard Deviation Calculation:
( \sigma = \frac{30 - 0}{\sqrt{12}} \approx 8.66 )
Probabilities:
Wait more than 25 minutes ( P(25 < wait < 30) ): Probability is 0.1667 (using area under PDF).
Wait between 10 and 20 minutes ( P(10 < wait < 20) ): Probability is 0.3333.
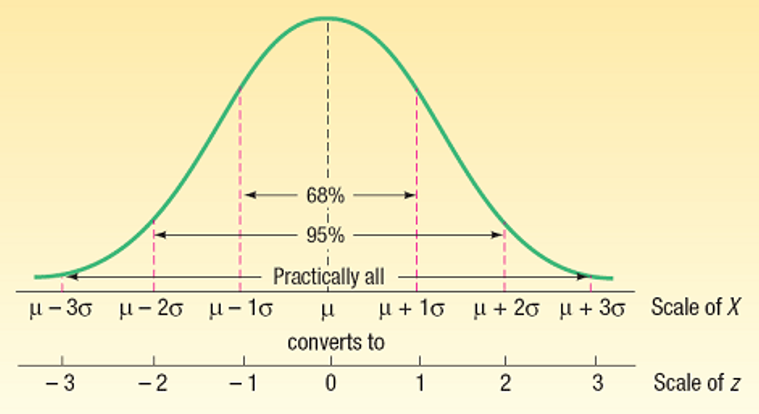
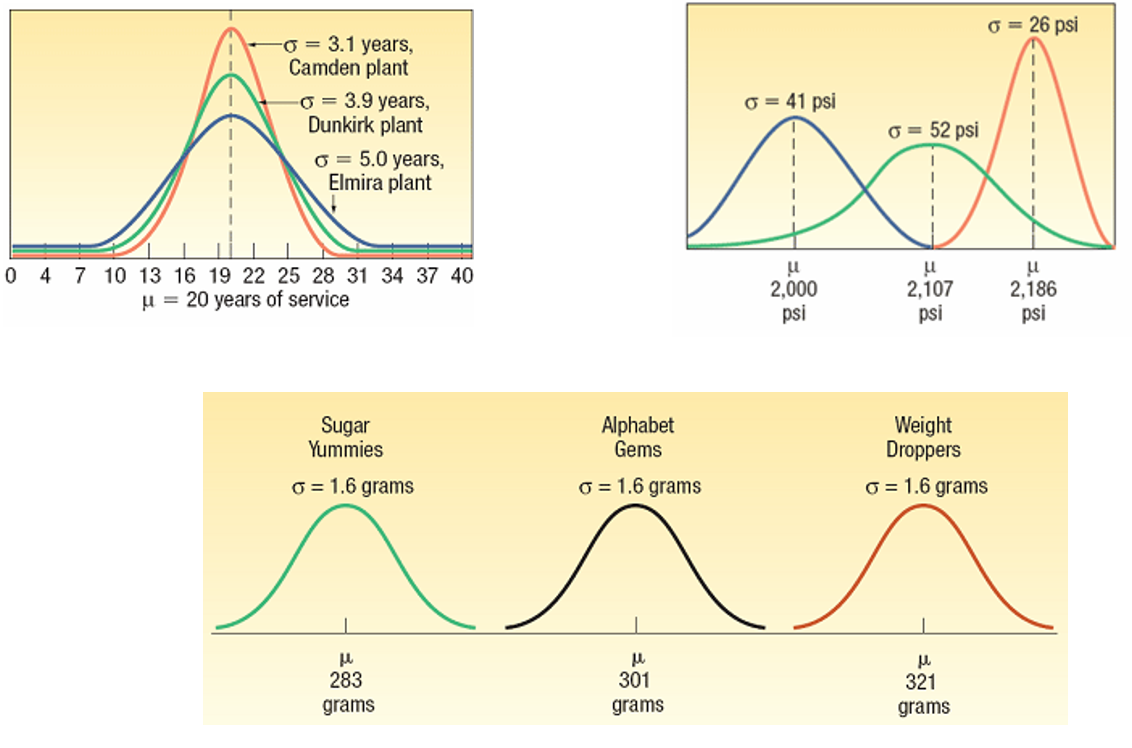
4.5 Normal Distribution
Characteristics:
Bell-shaped curve; symmetric around the mean.
Mean, median, and mode are equal.
Total area under the curve is 1.
Asymptotic: Tails approach the axis but never touch.
EXCEL: For not given Z GIVES ARES FOR Z
= NORM.DIST(X,MEAN, STANDARD DEVIATION, T/F)
all examples use true
may have to use empirical rule
subtract if in between
Empirical Rule:
68% of data within one standard deviation from the mean.
95% within two standard deviations.
99.7% within three standard deviations.
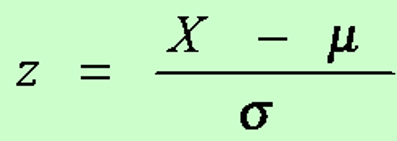
Standard Normal Distribution
Special case with mean 0 and standard deviation 1.
Z-value formula:
Excel: =NORM.S.DIST(Z,TRUE/FALSE) FOR if given Z
z<= TRUE
Z> TRUE 1- NORM.S.DIST(Z,TRUE)
Finding Probabilities
Use of cumulative standard normal distribution (NORM.S.DIST) to calculate probabilities.
Example: For Z = 1.5, find ( P(Z \leq 1.5) ).
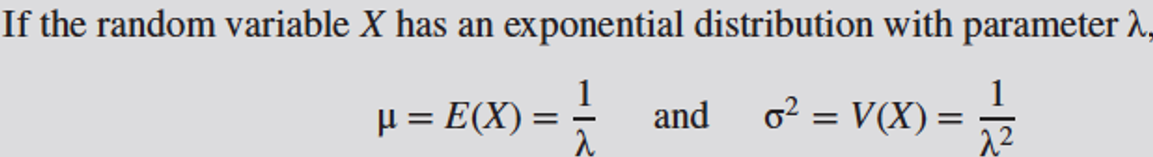
4.6 Exponential Distribution
Definition: Models the time until an event occurs in a Poisson process.
EXCEL:=EXPON.DIST(X,P(X),T/F)
true was used in all examples
Formula:
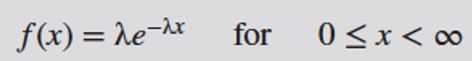
Mean and Variance: Both depend upon the rate parameter ( \lambda )
Applications of Exponential Distribution
Useful in modeling waiting times: e.g., time between customer arrivals, or failures of components.
Important Terms and Concepts
Continuous Uniform Distribution: All outcomes equally likely across an interval.
Normal Distribution: Symmetrical probability distribution; defined by mean and standard deviation.
Exponential Distribution: Describes time between events in a Poisson process.