AP Human Geography: Unit 2 - Population and Migration
2.1 - Population and Migration
Four Main Population Regions
South Asia
Ex: India, Bangladesh, Sri Lanka
East Asia
Ex: China, Japan, Korean Peninsula
Southeast Asia
Ex: Thailand, the Philippines, Vietnam
Europe
Unlike the others, has people located closer to natural resources instead of grouping around rivers and oceans
Due to Industrial Revolution
Why People May Live Where They Do
Rivers, oceans, fresh water, and fertile soil
People need food and water to live
Access to oceans and rivers that connect to other geographic areas allow places to participate in trade and commerce with places around the world
Economic opportunities
Political stability
Desired cultural preferences
Historical events that created the settlement
Density vs. Distribution
Density - the amount of people in an area
Distribution - the spread of people in an area
Population Densities
Arithmetic
Total population / Total amount of land
Physiological
Total population / total amount of arable land
The higher the number, the more stress is put on the arable land
Agricultural
Amount of farmers/ total amount of arable land
The higher the number, the more manual labor a society is using to produce food
The lower the number, the less human labor is needed
2.2 - Consequences of Population Distribution
Political Consequences
In places with uneven distribution, political power resides in larger urban areas compared to their smaller, rural counterparts
Individuals living in large populations have smaller political power
Ex: Citizens living in a state with a small population have more of an impact on their states electoral votes compared to those living in a larger population
If a society is dispersed, the government will have to provide more services over larger geographic areas, like public utilities
This could increase government spending
If a population is more clustered together, the government may not have to provide services over a large geographic area, but may have to provide other services
Ex: public transportation to reduce traffic congestion
Economic Consequences
More densely populated areas will have a wider variety of jobs and a larger pool of people to employ, but it will also make competing for jobs more difficult
Larger areas will have more goods and services for people to purchase compared to communities that have a low population density and are dispersed
The cost of living is higher in more populated urban areas compared to rural areas
Social Consequences
More populated areas have people with fewer children, since they want to focus on pursuing career, while less populated areas have people with more kids
Living in a smaller settlement will often result in traveling farther for specific services
Environmental Consequences
Rural areas have more green spaces than urban areas and undisturbed land
Urban areas will have less green spaces
Urban areas that keep growing horizontally often end up paving over arable land, green spaces, and merging with suburbs
Urban sprawl - the spread of urban development from an urban area into undeveloped land near a city
Carrying capacity - the amount of people that can be supported by the environment without damaging the environment
Exceeding this usually leads to desertification
2.3 - Population Composition
Sex Ratio - (number of male births / number of female births) * 100
> 100 - more male births
< 100 - more female births
Age Cohorts
Pre-reproductive years
0 - 14 yrs
Reproductive
15 - 44 yrs
Post-reproductive years
45 years and up
If the majority of a population is currently in pre-reproductive or reproductive years, it can be predicted that the society is going to grow at a much rapid rate than a society with a majorly post-reproductive population
Population Pyramid Patterns
Large base means high growth rate
Large top means low growth rate, or even negative growth
Looks more like a box means the society is close to their replacement rate
No population boom but stable growth
Dependency Ratio

Dependents (children under 14 and adults over 65) are either too young to join the workforce or have retired from it
If this number is small, it means the majority of people are in the working years and society will not need to provide a lot of services for the elderly or young
If this number is high, it means society will have more services and needs to provide but less taxes to fund them because people who don’t work don’t pay taxes
Child Dependency Ratio

A high number may mean that a society will need more schools or day care facilities
Elderly Dependency Ratio

If this number is high, society may need more retirement homes or healthcare facilities
2.4 - Population Dynamics
Key Terms to Review
Crude Birth Rate (CBR)
Total number of live births in a year for every 1,000 people alive in a society
Crude Death Rate (CDR)
Total number of deaths in a year for every 1,000 people alive in a society
Total Fertility Rate (TFR)
The average number of children a women will have
Infant Mortality Rate (IMR)
The total number of deaths under one year of age in a year for every 1,000 live births
Natural Increase Rate (NIR)
The percentage by which a population grows in a year
Sometimes reference as rate of natural increase
NIR = CBR - CDR
Does not take migration into account
Doubling time - the amount of time it takes for a population to double in size
Pro-natalist policies - policies that are created to help increase a society’s birth rate
Anti-natalist policies - policies that are created to help decrease a society’s birth rate
2.5 - The Demographic Transition Model
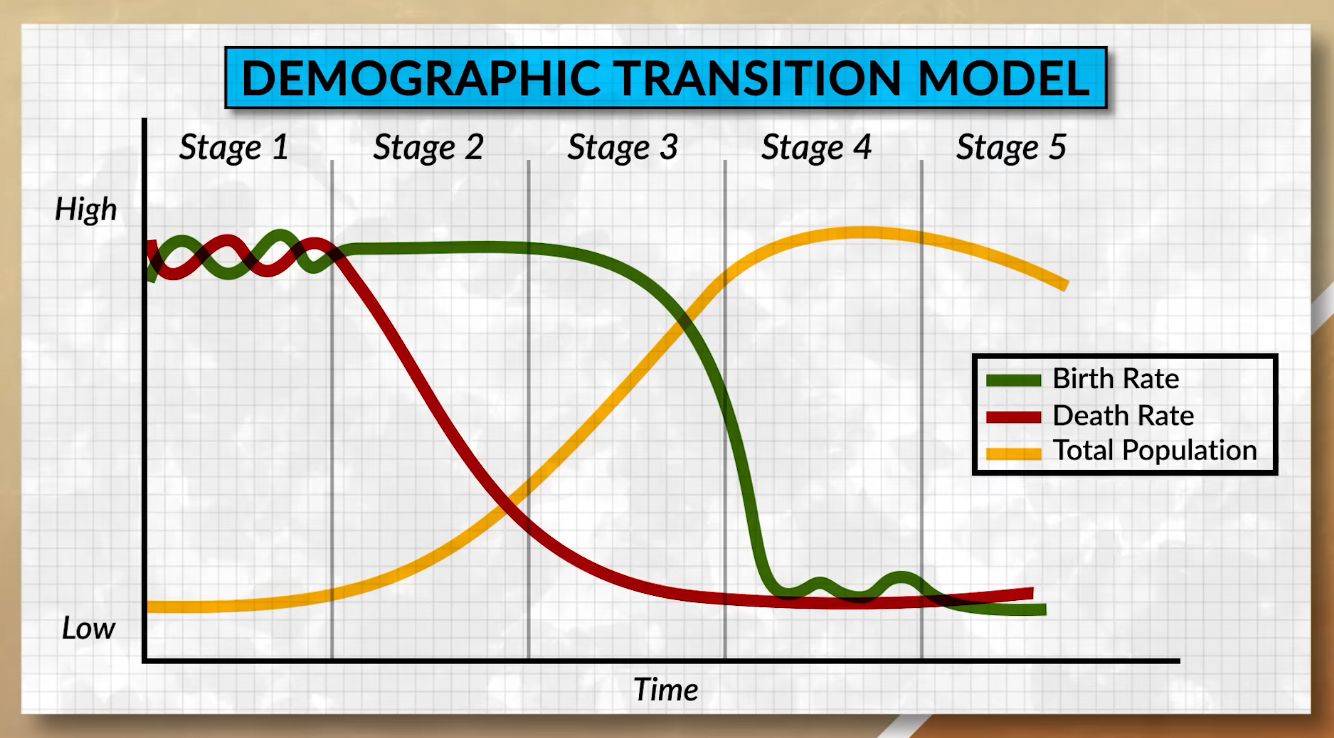
Theoretical Stage 5
Negative NIR
The birth rate goes below the CDR
Ex: Japan, Germany
Majority of their population is located in the post-reproductive years
Replacement rate - TFR above 2.1
Epidemiological terms
Epidemic
A disease that spreads through a region or community
Pandemic
A disease that spreads across multiple regions, countries, or possibly the world
Endemic
A disease that stays in a particular area and does not spread through the entire region or community
Epidemiological Transition Model (ETM)
Pestilence, Famine, Death
Parasitic diseases
Infectious diseases
Animal attacks
Pandemics
Epidemics
Food Shortages
Dirty Water
RWE: Bubonic Plague
From stage 1 to stage 2, there is a decrease in the amount of deaths caused by major diseases
Due to advancements in medicine, increase in food supply, higher standard of living
Less Deaths & Receding Pandemics
Improved standard of living
Increased food production
More nutritious food
Increase in sanitation
Degenerative Diseases
Definition:
A disease that continues to get worse over time
Examples:
Heart Attacks
Cancer
Fighting Degenerative Diseases
Medical advancements delay degenerative diseases
Longer life expectancies
Improved diets and lifestyle choices
Reemergence of Infectious Disease
Causes:
Evolution of disease
Increased poverty
Increased urbanization
Globalization
2.6 - Malthusian Theory and Geography
Malthusian Theory:
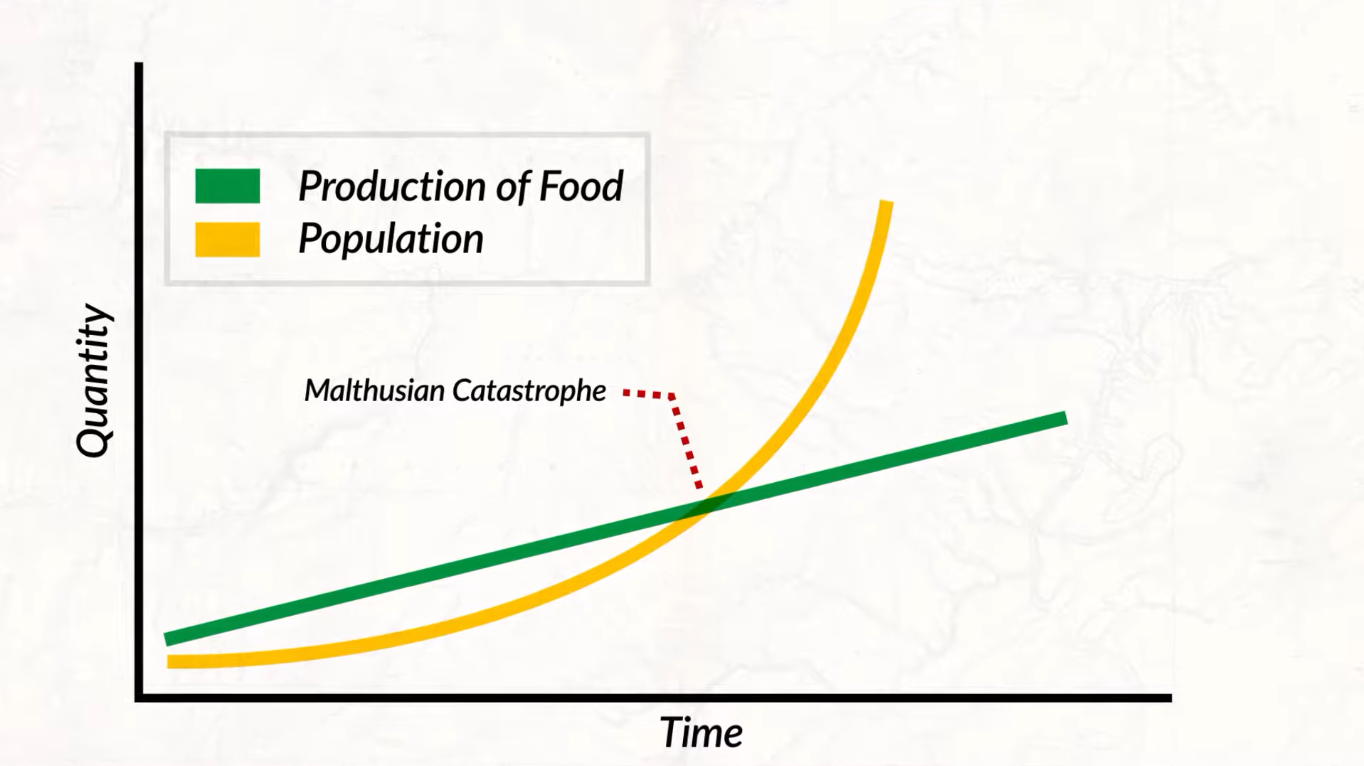
Malthus theorized that populations grow exponentially and the production of food grows arithmetically, which would result in the population exceeding the carrying capacity.
Population growth > food production
Critics of Malthusian Theory:
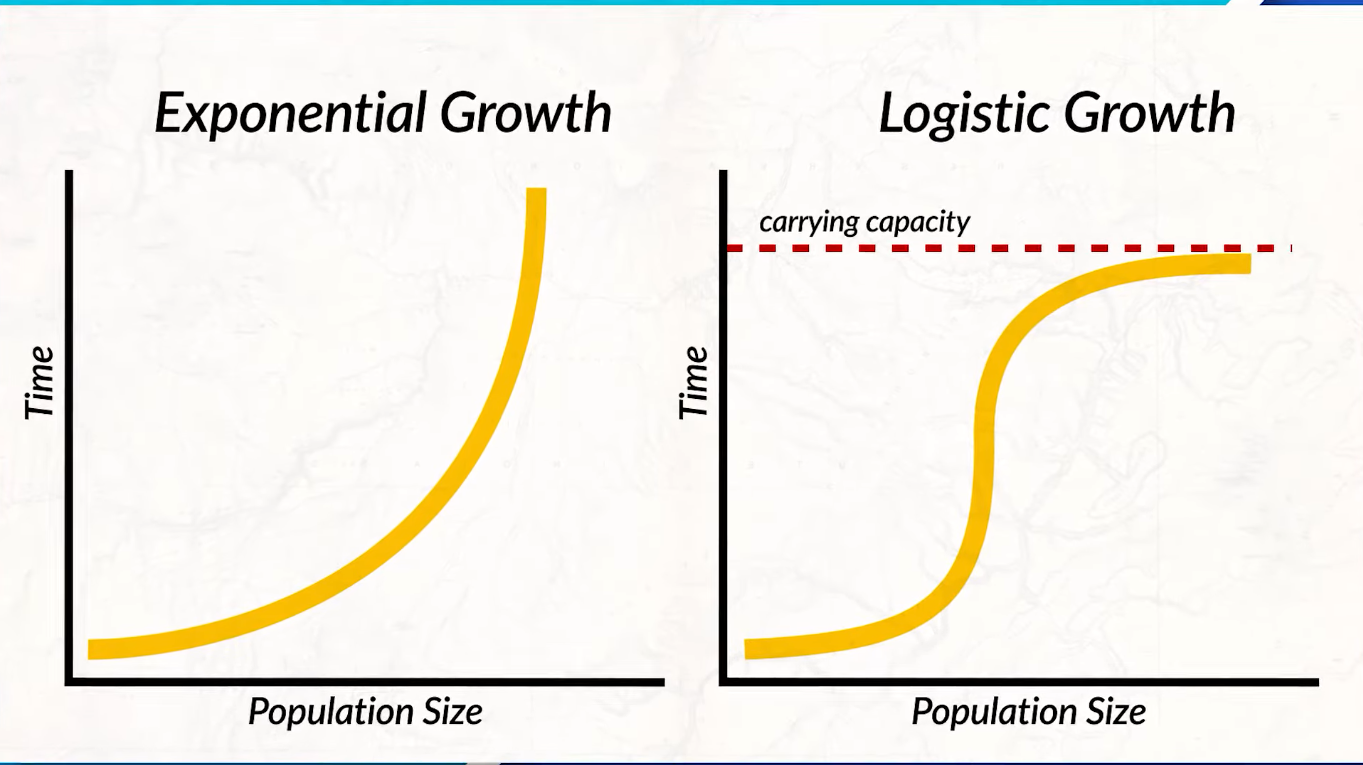
Malthus thought population growth was exponential, but he did not realize that as populations reach their carrying capacity, population growth begins to slow down.
2.7 - Population Policies
There are two types of government populations policies: pronatalist and anti-natalist
Pronatalist policies - policies that are created to help increase a society’s birth rate
RWE: Singapore’s National Night Out
Anti-natalist policies - policies that are created to help decrease a society’s birth rate
RWE: China’s One Child Policy
Immigration policies
Pro-immigration
RWE: H-1B Visa program
Allowed more skilled workers to enter the country
Anti-immigration
RWE: US passing the Chinese Exclusion Act
Prohibited immigration to the US
2.8 - Women and Demographic Change
Economic
Countries with less economic opportunities tend to have a higher TFR and GII
Countries with more economic opportunities tend to have a lower TFR and GII
Children cost more to raise in core countries, which may lead women and most people to not want many kids or kids at all
In periphery countries, having more kids can often be an economic asset
Societal
Countries with improved healthcare that is accessible to all people have a lower IMR and maternal mortality rate
Maternal mortality rate (MMR) - the annual number of female deaths per 100,000 live births from any cause related to pregnancy
Access to contraceptive resources and family planning can lead to a decrease in the NIR
When society moves away from traditional gender norms (ex: women being homemakers), we start to see the TFR and NIR decrease
Political
Governments that implement pro-natalist policies such as maternity leave, paternity leave, and covering childcare costs encourage people to have children
Ravenstein’s Laws of Migration
Most migration happens for economic reasons and is done by young adults
This is because young adults don't have many connections to a particular place and have more flexibility to take advantage of different opportunities
Migrants often travel short distances and will travel in step migration
Step migration - migration that happens in stages
Migrants will make stops on the way to their final destination
Migrants are more likely to move from a rural area to an urban area
The farther a migrant is traveling, the more likely they are to move to a larger city
Whenever migration happens, a counterstream is created
When a person migrates to a new place, they connect their original location with the new location
Large urban areas tend to grow more through migration than by their natural births
Migration increases economic development
Women are more likely to move internally within a country while most international migrants are young males