Unit 2 Micro - Supply & Demand
EQ: How does supply and demand correlate in the functionality of the United States economics?
2.1 - Demand - Top Left to Bottom RIght
The Law of Demand - There is an inverse relationship between price and quantity demanded.
Ie. When the price goes down for milk, the quantity consumers buy will increase.
Substitution Effect - Changes in price motivate consumers to buy relatively cheaper substitutes goods.
Income Effect - Changes in price affect the purchasing power of consumers income.
The Law of Dimishing Marginal Utility - As you continue to consume a given product, you will eventually get less additional utility (satisfaction) from each unit you consume.
Why does the Law of Demand occur?
The Substitution Effect - if the price goes up for a product, consumer buy less of that product and more of anouther substitue product (and vice versa)
The Income Effect - If the price goes down for a product, the purchasing power increases.
5 Shifters of Demand:
1. Taste/Prefrences - ie. Hydroflask v. Stanley
2. Number of Consumers
3. Price of Related Goods (substitutes)
4. Income
5. Expectations
Normal Goods - Income and the demand for the product are directly related.
ie. jewelery
Inferior Goods - Income and the demand for the product are inversely related.
Ie. used items
Changes in Quantity Demanded v. Change in Demand:
Shift along the demand curve is a change in quantity demanded. (ie. Price change)
A change in the entire demand curve occurs due to one of the five shifters. (ie. taste, consumers, subs., income, and expectations)
What happens to the demand for a product when the price decreases? - Demand stays the same, but the quantity demanded increases.
2.2 - Supply - Bottom Left to Top Right
The Law of Supply - There is a direct relationship between price and quantity supplied.
ie. When the price goes up for milk, the quantity producers make will increase.
5 Shifters of Supply:
1. Price of Resources
2. Number of Producers
3. Technology
4. Taxes & Subsidies
5. Expectations
6. Natural Disasters
Price changes the quantity supplied - (moves along the curve)
The 5 shifters change the supply - (moves the entire curve)
Supply & Demand Equilibrium:
The price at which the quantity demanded equals the quantity supplied.
What happens to the supply for a product when the price increases? - Supply stays the same, but quantity supplied increases.
A SURPLUS is when the quantity supplied is greater than the quantity demanded. (It also eventually evens out in the long run.)
A SHORTAGE is when the quantity demanded is greater than the quantity supplied. (It also eventually evens out in the long run.)
2.3 - Elasticity of Demand
Elasticity of Demand - Measures how sensitive quantity demanded is to change in price.
Types of Elasticity - Price Elasticity of Demand (PED), Price Elasticity of Supply (PES), Cross Price (XED), Income (YED).
Each of the have similar equations. Elasticity of demand is the most important.
Inelastic Demand - When theres an increase in price the quantity demanded decreases - a little bit.
Quantity is INsensative to change in price.
1. Few Subs.
2. Necessities
3. Small portion of income
4. Required now, rather than later
5. Elasticity coefficient less than 1
Elasticity of Demand Coefficeint:
% Change in Quantity Demanded / % Change in Price
(% change = New # - Old # / Old # * 100)
ie. | 10% dec. / 30% inc. | < 1
ie. If it’s less than 1, it’s relatively INELASTIC demand (High Top Left to Tight Bottom Right) - STEEP
Example - Gas, Milk, Diapers, Medical, Toilet Paper, Gum
ie. | 40% dec. / 10% inc. | > 1
ie. If it’s greater than 1, it’s relatively ELASTIC demand (Medium Left to Medium Right)
Has many substitues. (Soda, Pizza, Beef, Real Estate)
Elastic Demand - Quantity is sensative to a change in price. The amount people buy is sensative to price.
1. Many subs.
2. Luxuries
3. Large portion of income
4. Plenty of time to decide
5. Elasticity coefficent greater than 1
| 20% dec. / 20% inc. | = 1
When it’s equal to 1, it’s UNIT ELASTIC demand (Top Left to Bottom Right Uniformly)
Example - insulin
Perfectly Inelastic - Straight Up & Down
% Change in Quantity / % Change in Price = 0
Perfectly Elastic - Straight Left & Right
% Change in Quantity / % Change in Price = (Infinity)
Example - Currency
The elasticity of demand coefficent is always negative. These numbers are the ABSOLUTE VALUE.
Price Elasticity of Demand (PED) - Measure how sensative quantity demanded is to change in price.
Knowing how consumers will respond to a change in price is extremely usefuls for firms.
Why does elasticity matter?
Helps them decide what to charge.
Helps determinne how many subs. are in the market.
Used by the gov. to devide charges.
Total Revenue Test = Price x Quantity Demanded (Only Works for Demand)
Ie. 10 × 100 = $1000 TR and 5 × 225 = $1125 TR (Price dec. and TR inc.)
Inelastic - ( Price inc., Total Revenue Inc. ), ( Price dec., Total Revenue dec. )
Elastic - ( Price inc., Total Revenue dec. ), ( Price dec., Total Revenue inc. )
P.S. - Do the hand jestures, for “I”nelastic bring both hands up or down, for elastic bring one arm up and one arm down, vice versa.
Unit Elsatics - Price changes and TR remains unchanged.
2.4 - Price Elasticity of Supply
Price Elasticity of Supply (SED) - Measures how sensative quantity supplied is to change in price. (Ie. Fidget Spinners)
Elasticity of supply shows how sensative producers are to change inprice.
Based on time limitations, (% Change in quantity / % Change in price)
Inelastic = Insensitive the change in price.
Most goods have inelastic supply in the short-run.
1. hard to produce
2. high barriers to entry (few firms)
3. high cost or specialized inputs
4. hard to stich from producing alt. goods
5. <1
Elasic = Sensative to a change in price.
Most goods have elastic supply in the long-run.
1. easier to produce
2. low barriers to entry (many firms)
3. low cost or generic inputs
4. easy to switch from producing alt. goods
5. >1
Perfectly Inelastic Supply = Quantity supplied doesn’t change, set quantity supplied (Vertical Line) (Ie. Artifacts/Mona Lisa Painting)
Visualized -
Perfectly Inelastic - Up & Down ( 0 )
Relatively Inelastic - Bottom left to Top Right/STEEP ( <1 )
Can only be one, Sculptures and Arts
Unit Elastic - Bottom Left to Top Right ( 1 )
Relatively Elastic - Medium Left to Medium RIght ( >1 )
Perfectly Elastic - Left and Right (infinitly)
Example - Calculate the PES from A to B, and elasticity -
(35 - 20) / 20 - Q.Supplied
(30 - 20 ) / 20 - Price
.75 / .5 = +1.5, Elastic
2.5 - Other Elasticities
Cross-Price Elasticity of Demand (XED) - Measures how sensative quantity demanded of one product is to a chnage in price of a different product.
It shows if two goods are subs. or complements -
(% Change in quantity of product “b” / % chnage in price of product “a”)
If coefficent is positive (shows direct relationship) then the goods are substitutes.
If coefficent is negative (shows inverse relatiionship) then the goods are complements.
Income Elasticity of Demand (YED) - Measures how sensative quantity demanded is to change in income.
It shows if goods are normal or inferior -
(% change in quantity / % chnage in income)
If the coefficent is positive (shows direct relationship) then the good is normal.
If the coefficent is negative (shows inverse relationship) then the good is inferior.
2.6 - Market Equilibrium and Consumer and Producer Surplus
Market equilibrium - QD = QP + Supply intersects Demand
It will always self correct itself.
Surplus = Over the market equilibrium
Shortage = Below the market equilibrium
Look at the Demand and Supply Schedule to determine the shortages and surpluses
Price Signals - To describe how prices convey info and help socitey use scarce resources more efficently.
Consumer Surplus + Producers Surplus:
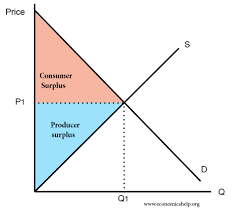
Consumer - The difference between what you are willing to pay and what you actually pay.
Producer - The difference between the price the seller recieved and how much they were willing to sell it for.
Right Triangle Form - (a*b) / 2
Total Consumer Surplus - Area (PS) + Area (CS)
2.7 - Consumer Surplus & Producer Surplus
Double Shifts -
Double Shift Rule - If two curves shifts at the same time, either price or quantity will be indeterminate (ambiguous)
Draw shifts seperately***
2.8 - Government Intervention in Markets
Price Controls -
P Floor (P1) = Minimum Wage, Min. price a seller can sell a product.
P Ceiling = Maxiumum legal price a seller can charge for a product.
Surplus of Labor - Above the (P1) and equilibrium
Ineffective floor or ceiling is when they go over or below the equilibrium.
Shortage (Qd>Qs), also resultes in the black market.
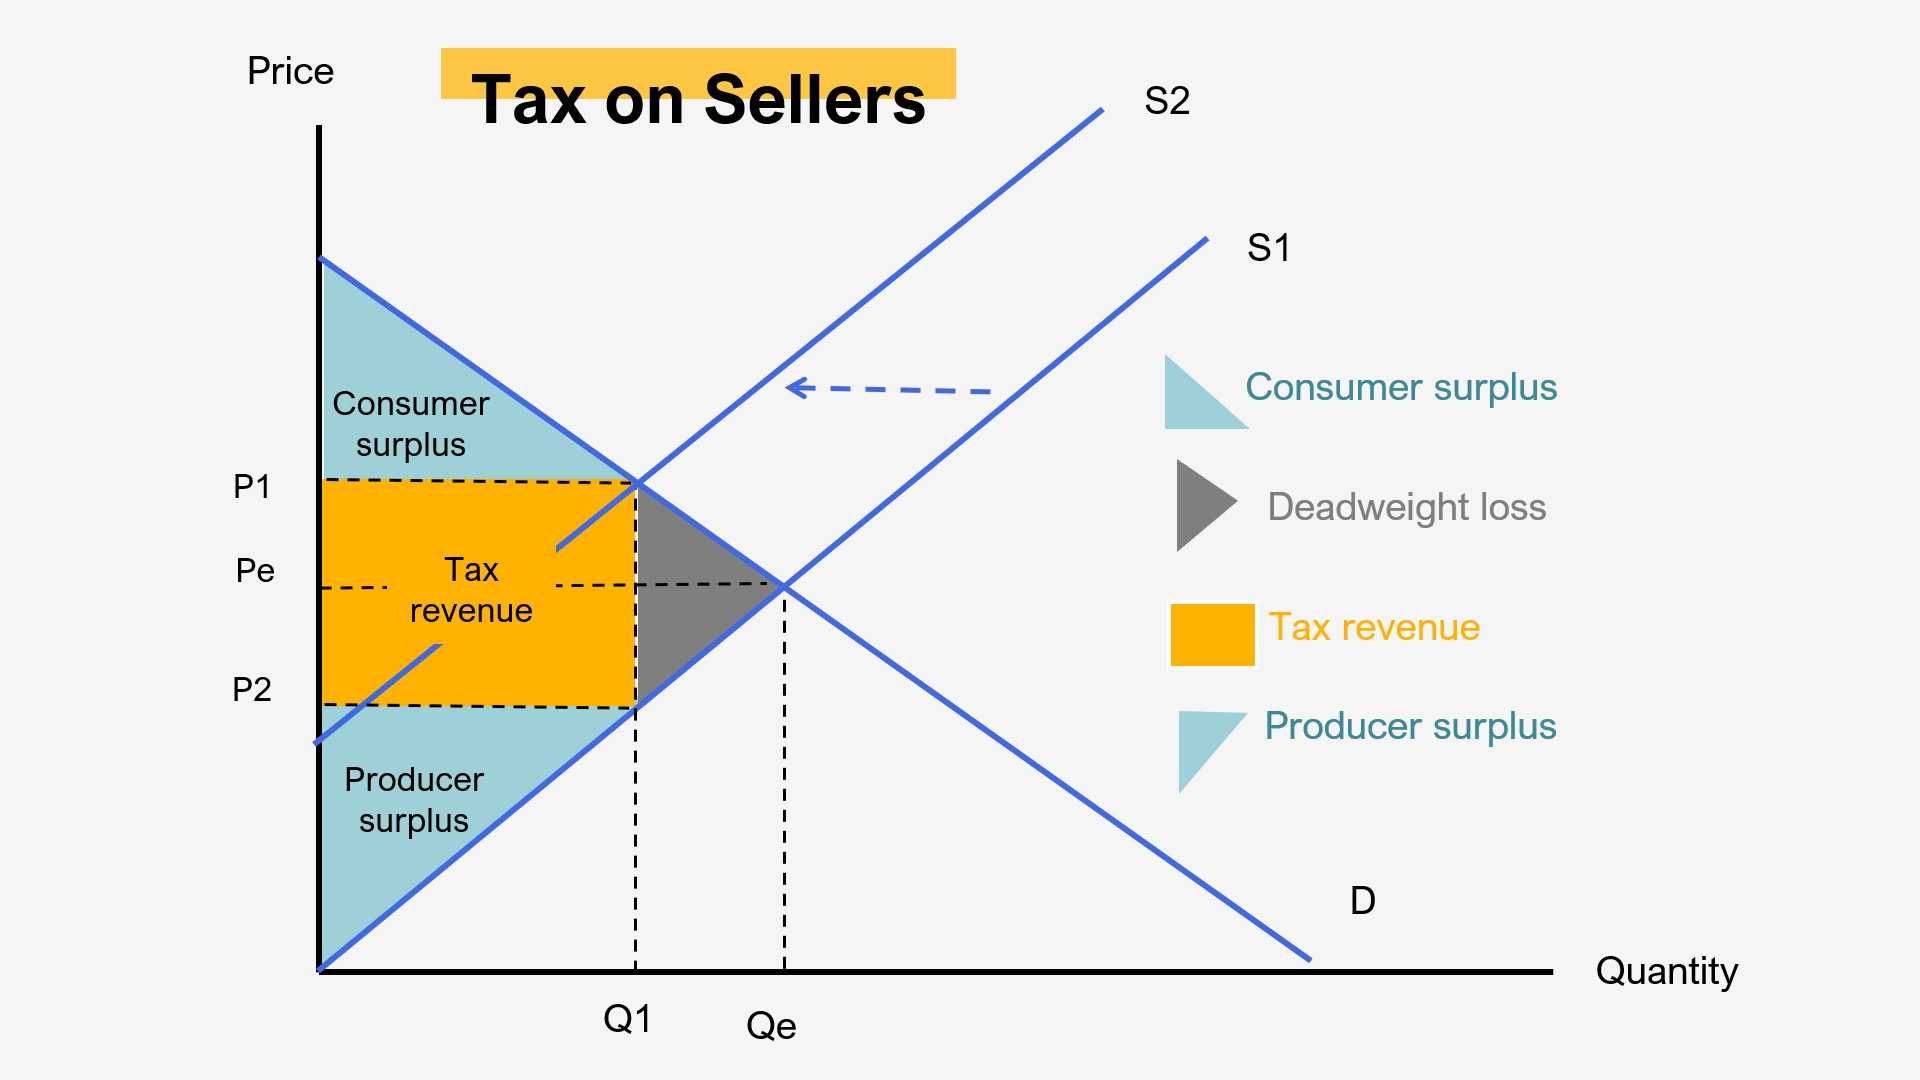
Deadweight Loss - The lost CS and PS
Excise Taxes - A per unit tax on producers.
For every unit made, the producer must pay money not a lump sum tax. The goal is for them to make less of the goods that the government deems dangerous or unwanted.
Ie. Vapes, Drugs
2.9 - International trade and Public Policy
World Price - Coutnries can buy proucts at their own domestic price or they can buy the products at a cheaper world price.
Tarriff - Tax on imports that increases the world price.
Qoute - A limit on number of imports.
Purpose:
To protect doemstic producers from a cheaper world price.
To prevent domestic unemployment.