2.1 measures of econ performance
economic growth occurs when rise in GDP
DEFINITIONS:
total GDP = the combined monetary value of all goods and services produces within a country’s borders during a specific time period
real GDP = value of GDP adjusted for inflation
GDP per capita = value of total GDP/ pop of country, useful for comparing the relative performance of countries
volume of GDP = GDP adjusted for inflation, the size of the basked of goods and the real level of GDP
value of GDP = monetary value of GDP at prices of the day, nominal figure and can be calculated by volume times current price level
Gross National Product (GNP) = market value of all products produced in an annum by the labour and property supplied by the citizens of one country. includes GDP plus income earned from overseas assets minus income earned by overseas residents. GDP is within a country’s borders, whilst GNP includes products produced by citizens of a country, whether inside the border or not.
Gross National Income (GNI) = sum of value added by all producers who reside in a nation, plus net overseas interest payments and dividends. includes what a country earns from overseas and removes any money that is sent back home by foreigners in that country.
THEORY:
PPP Purchasing Power Parity = theory that estimates how much the exchange rate needs adjusting so an exchange between countries is equivalent according to each countries purchasing power. helps to minimise misleading comparisons between countries
limitations to GDP: we assume gdp increase then y (income) increase, but don’t sometimes. the inequality of benefits of growth “a tide that raises all boats” not true. gdp is simple & gives good info on prod but…
doesnt give indication of the distribution of income Indias GDP = $3.9tn
potential double counting inflates gdp
doesn’t account for negative externalities so pollution
doesnt account for population, like gdp per capita does which indicates different living standards
informal hidden economies, black market and illegal trade. make gdp comparisons misleading and lowers figure.
gdp may need to be recalculated for purchasing power so it can account for int. price diff
gives no indication of welfare, UK economy increase 5% in GDP per capita between 2007 and 2014, but showed no change in life satisfaction. generally though higher gdp = higher avg life sat score.
GDP growth = new - old/ old x 100
DEFINITIONS:
inflation = sustained rise in the general price level over time
deflation = avg price level in economy falls, negative inflation rate. oft caused by fall in ad meaning increased unemployment
disinflation = falling rate of inflation, avg price level still rising but at slower extent.
index = set a base year and set its value to 100, this acts as a benchmark and allows for comparisons over time.
INFLATION is measured by CPI and RPI (consumer and retail price indexes)
CPI: measures household purchasing power via survey to find out what ppl spend money on, what proportion of their income is spent on those items creating a weighted basket of goods. measures avg price change of the goods & updated annually.
BUT
only representative of avg hh, not accurate for those that dont own cars.
inform given by hh may be inaccurate
diff demographics have diff spending patterns
cpi slow to respond to new goods & services, even though updated reg
hard to make historical comp as tech very diff quality
RPI: CPI but takes into account housing costs e.g mortgage & council tax so tend to have higher value. excludes top 4% of earners and low income pensioners and doesnt take into account when prices rise people switch to products that have gone up by less - cpi does take this into account.
cpi & rpi important for policy, help determine wage & state benefits. employers & trade unions use as starting point for wage negotiations.
inflation measures changes in int competitiveness, if inflation high then goods will become less price competitive, exports fall & imports seems relatively cheaper compares to domestic goods than prior.
DEMAND PULL: excessive growth in ad compared to as. pressure on resources, prod increase price. right shift in short term ad. caused by
depreciation in exchange rate, imports more expensive, exports cheaper so ad rise
fiscal stimulus, lower tax or increase govt spend, consumer have increased disposable income so spending increases
lower ir, saving less attractive & borrowing more attractive
high consumer spending/ high exports - caused by high confidence, low ir (cheap borrowing). high foreign demand caused by increase econ of foreign countries
money supply growing faster than output, amt of money produced lowers value
ad increase when labour & resources already at cap, increased output lead to shortages (positive output gap) price increase
COST PUSH INFLATION: rising cost of inputs to production. forces producer to pass cost to consumer. caused by
raw materials/ labour more expensive
expectations of inflation, consumers expect price to rise so demand higher wages triggers more inflat
indirect taxes increases cost of cigs/ fuel, but if good price inelastic more of tax cost shifted to consumer
depreciation in exchange rate, imports more expensive which pushed up prices of raw mat.
monopolies using dom market position to exploit consumers
CONSEQUENCES OF INFLATION:
std of living for those on fixed/ near fixed incomes falls. those on low income employment/ welfare benefits as purchasing power reduction. govt will then have to increase value of state pension & welfare payments
real income falls with inflation, less disposable income for workers
increased redundancies increasing unemployment
value of repayment of consumer loans will be lower, real value of debt decreases
firms less likely to invest as cost is higher with high ir
firms less price competitive on a global scale if inflation high. balance of payments increase and ad reduce increasing unemployment
reluctance to save causes shortage of funds for banks, lending & investment decrease so saving decrease again (harrod-domar model)
The effects on individuals, such as firms, consumers or workers, are microeconomic impacts whilst the inflation figure itself is a macroeconomic impact- this shows how the macro-economy has microeconomic effects.
UNEMPLOYMENT: measured by the claimant count and the labour force survey.
unemployed = those able & willing to work but not employed, actively seeking work & looking to start within next 2 weeks
underemployed = those who have a job but labour not used to full productive potential, part time work but looking for full time.
claimant count - number of people claiming job seekers allowance, fast & easy to find but easy for govt to manipulate figure e.g raising school leaving age to 19, also not everyone eligible to claim if partner has high income.
labour force survey - asks people who are working whether they are seeking employment, thought to be more accurate & used int. as part time unemployed less likely to claim jsa. however less up to date, expensive to collect & only sample of population.
the economically inactive = elderly, disabled, children, people who not actively looking for jobs, size of labour force decreases if this increases, means prod potential of econ falls.
CHANGES IN EMPLOYMENT
consumers = if unemployed, less disposable income, std of living fall, psych consequences of losing a job
firms = higher unemploy firms have larger supply of labour to recruit from so wages fall, firms reduce cost but also visa versa when unemploy low wages increase as less available in job market. cost of onboarding, consumers have less disposable income w high unemploy so firms lose profit
workers = waste of their resources with high unemploy. lose existing skills
govt = spent more on jsa incurs opp cost as could be invest elsewhere. recieve less revenue from indirect tax & revenue tax
society = opp cost, workers could have prod g&s if employed, negative externalities of crime & vandalism.
TYPES OF UNEMPLOYMENT:
structural - mismatch of skills to people, long term decline in d for g&s in industry, mines in north eng/s wales closed and miners become unemployed. machinery & globalisation exacerbates.
cyclical/ demand deficiency - economic downturns, 2008 housing crisis & great depression, lack of d for g&s usually during periods of economic decline, profits fall.
frictional - time between leaving job & looking for another, temporary.
seasonal - summer & winter, summer increase of people in tourist industry when demand increases, christmas tree business etc.
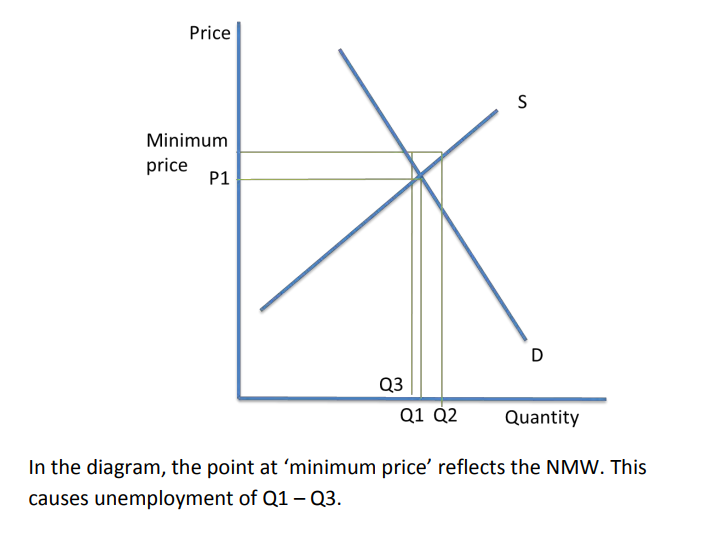
classical - real wage inflexibility, wages above market equilib may cause unemployment, classical econ argues by letting wage fall to equib there no unemploy removing nmw. made on assumption of perfectly compet market, which isnt true
geographical - workers cannot move to find jobs, geographical immobility of labour. migrants can increase productivity & skillset of labour market increase global competitiveness.
Whilst unemployment is a macroeconomic concept, it has microeconomic impacts in terms of its impacts on individual groups such as consumers.
BALANCE OF PAYMENTS: record of all financial transactions made between consumers, firms, govt from one country with other countries. states how much spent on imports and what value of exports is.
exports - g&s sold to foreign countries, positive in bofp as inflow of money
imports - g&s bought from foreign countries, negative in bofp as an outflow of money
current account
capital account
official financing account
current account = balance of trade in g&s
ca surplus = net inflow of money into circular flow of income, uk has surplus with services but deficit with goods.
uk has ca deficit, means uk spends more on imports than it earns from exports, if deficit large & long time could be issues with financing it.
UK MACROOBJECTIVES:
full employment
low, stable inflation
sustainable ca on b of p
sustainable econ growth
by selling more exports uk have greater inflow of money into c flow of inc, increase ad improving rate of econ growth
econ decline, ca deficit falls as consumer spending falls, with growth deficit increases on ca
imported raw mat expensive there could be cost-push inflation in uk since firms face higher prod costs
int trade meant countries become interdependent, econ condition of one country affect another country since quantity they export/import will change.