Statistical Enquiry Cycle (EdExcel)
What is the Statistical Enquiry Cycle?
A structured framework for conducting real-world statistical investigations.
It consists of iterative steps that are repeated and refined to ensure thoroughness and accuracy.
Cycle: No simple beginning or end.
The cycle’s iterative nature involves an 'improve-repeat' process, allowing for continuous enhancements and adjustments, which ensures the investigation evolves and improves over time.
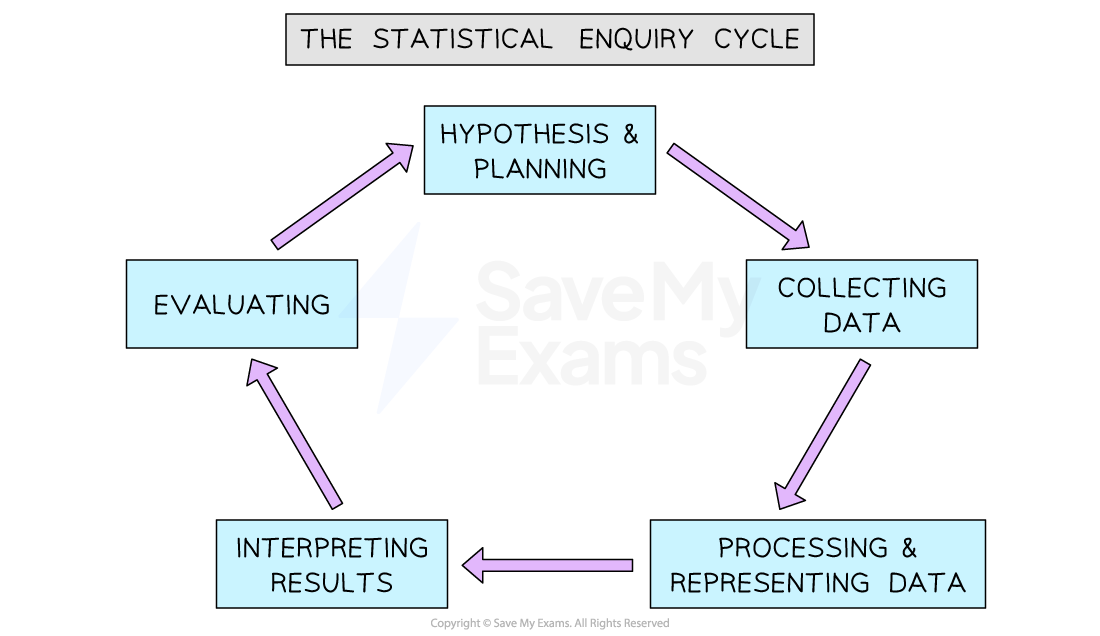
Five Stages of Statistical Enquiry Cycle
1. Hypothesis and Planning
Specify a Hypothesis: Formulate a clear, testable statement you intend to investigate. For example, "Older cars have higher annual maintenance costs."
Data Collection Plan: Determine what data you need and how you will record it. This involves deciding the variables to measure, the sources of data, and the method of data collection (e.g., surveys, experiments).
Data Processing Plan: Outline how you will organize and analyze the data. This includes data cleaning procedures, statistical methods to be used, and tools for analysis.
Data Representation Plan: Decide how to represent the data visually (e.g., graphs, tables, diagrams). Choose appropriate formats that will best illustrate the findings.
Justification: Provide reasons for each choice made in the plan, ensuring they are aligned with the objectives and constraints of the investigation.
2. Collecting Data
Design to Minimize Bias: Create data collection methods that reduce bias. This might involve random sampling techniques or ensuring a diverse sample population.
Sensitivity Issues: Consider potential sensitivities related to the data. Be mindful of ethical issues and participant comfort.
Primary Data Collection: Use methods such as surveys, interviews, experiments, or observations to collect fresh data directly from sources.
Secondary Data Usage: Evaluate and possibly use existing data from reliable sources, ensuring its relevance and accuracy for your investigation.
3. Processing and Representing Data
Organize and Process: Sort and structure the collected data according to the predefined plan. This includes categorizing data and converting it into a usable format.
Data Cleaning: Identify and correct any errors or inconsistencies in the data. Remove duplicates and handle missing values appropriately.
Visual Representation: Create visual representations such as charts, graphs, and tables to make the data more understandable and accessible.
Summary Statistics: Calculate key statistics (mean, median, mode, standard deviation) to summarize and compare data points.
Audience Consideration: Tailor the presentation of data to suit the target audience, ensuring clarity and relevance.
Source Acknowledgment: Cite all sources of secondary data to maintain transparency and credibility.
Technology Utilization: Use software tools for data analysis and visualization to save time and reduce the risk of errors.
4. Interpreting Results
Contextual Interpretation: Analyze the summary statistics and visual data representations in the context of the hypothesis and the overall investigation.
Draw Conclusions: Based on the data analysis, draw conclusions that directly address the initial hypothesis.
Inferences and Predictions: Make informed inferences and predictions related to the hypothesis, supported by the data.
Reliability Assessment: Comment on the reliability and validity of the results, considering any limitations or potential biases.
5. Evaluating
Identify Issues: Review the entire process to identify any problems or limitations in data collection, processing, and representation.
Suggest Improvements: Propose practical improvements to address identified issues and enhance the investigation’s accuracy and efficiency.s.
Reflect on Representation: Consider how well the data representations conveyed the findings to the target audience and suggest better approaches if needed.
Iterative Process: Plan to repeat the investigation with the suggested improvements to further refine and validate the hypothesis.
Hypotheses & Constraints: What is a Hypothesis and How Can It Be Tested?
Hypothesis
A specific, testable statement formulated at the start of a statistical enquiry. It aims to make a prediction or assertion about a relationship between variables. For instance, a hypothesis might be "As cars get older, their annual maintenance costs increase." It should be articulated clearly before any data collection begins, serving as the foundation for the entire investigation.
Testing Hypothesis
Collecting Valid and Relevant Data: Gathering data that directly relates to the hypothesis is crucial. This data must be accurate, reliable, and pertinent to the question at hand.
Appropriate Data Analysis: Using suitable statistical methods to analyze the collected data is essential to test the hypothesis. This may involve descriptive statistics, inferential statistics, or more advanced techniques depending on the nature of the data and the hypothesis.
Constraints
Constraints are practical limits that can impact how a statistical investigation is conducted.
These must be anticipated and incorporated into the planning phase to ensure the investigation is feasible and effective.
Types of Constraints
Time
Limited Investigation Time: Often, there is a finite amount of time available to conduct an investigation. It’s essential to develop a plan that ensures the investigation can be completed within this timeframe.
Planning for Completion: This involves setting realistic deadlines for each stage of the enquiry and ensuring that tasks are manageable within the given period.
Cost
Budget Limitations: Financial resources may be limited, which can restrict the scope of the investigation.
Affordable Planning: It's important to design the best possible investigation within the available budget, prioritizing essential elements and possibly finding cost-effective alternatives.
Ethical Issues
Participant Well-being: Ensuring that the investigation does not harm participants and that their rights and dignity are respected.
Ethical Considerations: This includes obtaining informed consent, ensuring anonymity, and being mindful of any potential psychological or physical risks.
Confidentiality
Protecting Information: Participants may be unwilling to share sensitive information unless assured of confidentiality.
Maintaining Confidentiality: Any confidential data collected must be securely stored and only used for the investigation, ensuring that participants’ identities and data are protected.
Sensitivity
Discomfort with Topics: Participants might feel uneasy discussing certain topics, which can affect their willingness to provide accurate data.
Addressing Sensitivity: How data is collected and who collects it can significantly impact the comfort levels of participants. Using anonymous surveys or trained interviewers can help mitigate these issues.
Convenience
Data Collection Challenges: Some data might be difficult to find or collect due to logistical issues or limited access.
Other Issues Affecting Investigation
Anticipating potential problems that might arise during the statistical enquiry process is crucial. Proactively thinking of solutions can help mitigate these issues before they become significant obstacles.
Examples:
Identifying the Study Population: Defining and accessing the population you want to study can be challenging. Careful planning and sampling strategies are necessary.
Incomplete Responses: Participants might not answer all questions, leading to gaps in data. Designing the survey to be engaging and straightforward can help improve response rates.
Unexpected Outcomes: Some results may be surprising or counterintuitive. Being open to all possible outcomes and planning for thorough analysis can help manage these surprises effectively.