Star Clusters and The Main-Sequence Phase (Part 2)
Plotting a star cluster on an H-R diagram reveals its age
Star Cluster Formation and Observation
Stars often form in open clusters, providing astronomers with data on stellar infancy.
Examples include:
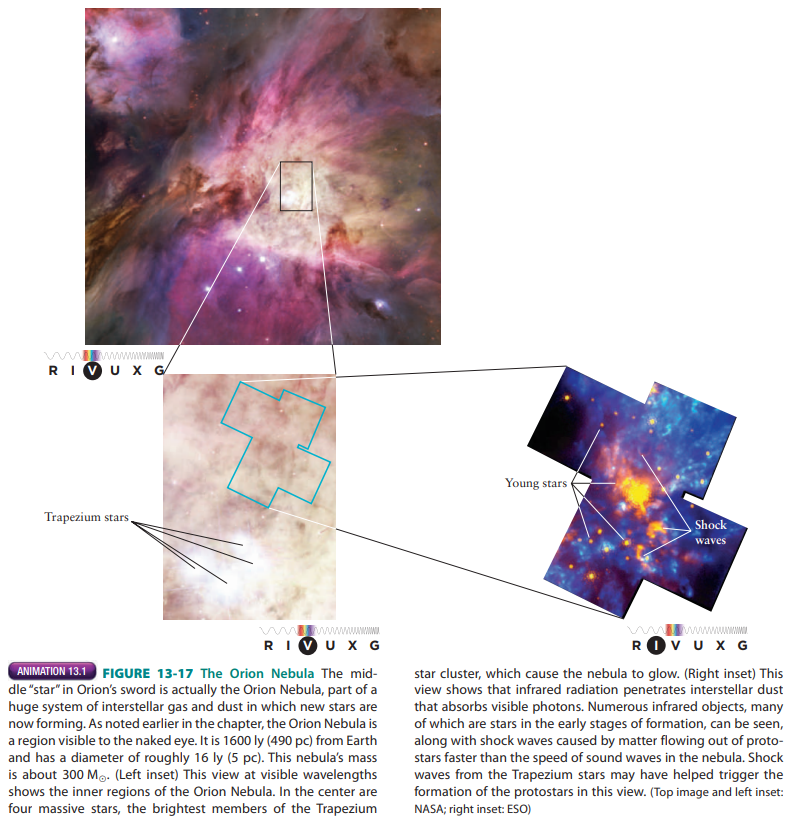
The Orion Nebula.
Pleiades.
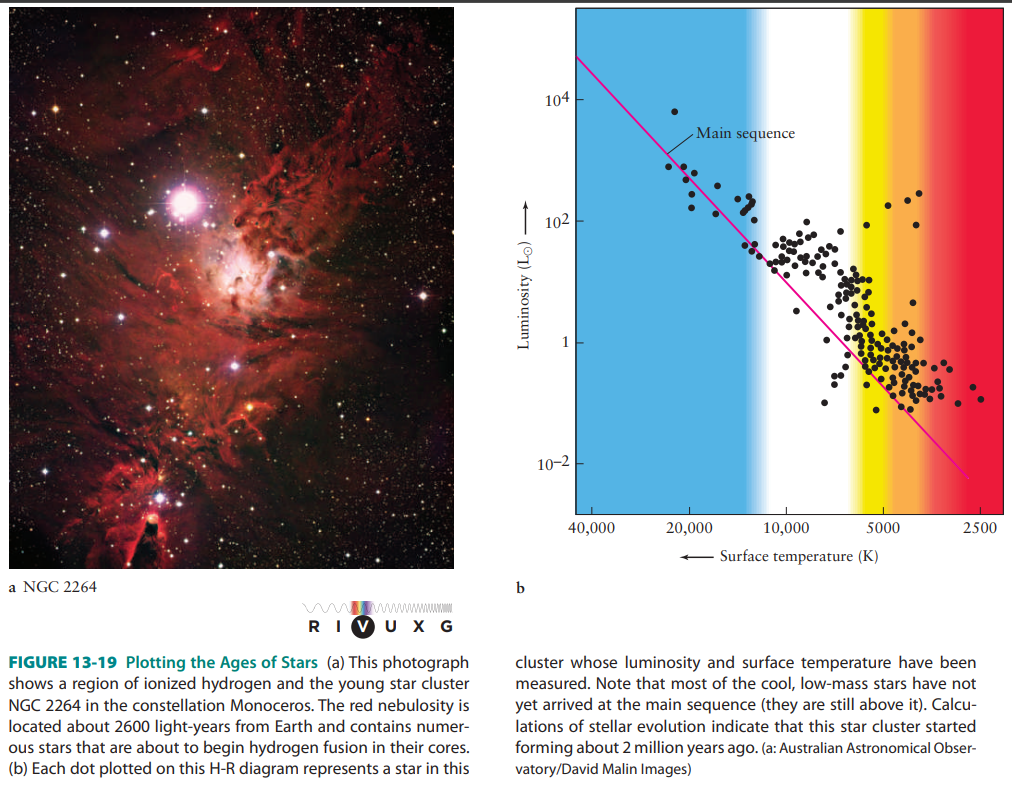
NGC 2264.
Determining Cluster Age Using H-R Diagrams
Astronomers use H-R diagrams to determine a cluster's age by plotting individual stars' luminosities and surface temperatures.
All stars in a cluster begin forming simultaneously.
Stars with different masses arrive on the main sequence at different times:
More massive stars arrive on the main sequence earlier.
Less massive stars take longer to reach the main sequence, remaining in pre-main-sequence contraction.
By observing which stars have entered the main sequence, specifically the lowest-mass stars that have just arrived, and using stellar evolution theories, the cluster's age can be determined.
Examples of Star Cluster Ages
NGC 2264:
Roughly 2 million years old.
Hottest, most massive stars are on the main sequence.
Stars cooler than about 10,000 K are still in pre-main-sequence contraction.
Pleiades:
About 100 million years old.
Nearly all stars have completed their pre-main-sequence stage.
Dissipation of Open Clusters
Open clusters eventually dissipate.
They possess low mass, making them gravitationally unstable.
Stars can escape, reducing the cluster's gravitational force and facilitating further star departures.
Most open clusters separate and mix with the Galaxy's stars within 10-50 million years, though some can persist for a few hundred million years.
Stars spend most of their lives on the main sequence
Zero-Age Main Sequence (ZAMS)
Defined as locations on the H-R diagram where pre-main-sequence stars first become stable, neither shrinking nor expanding.
Represented by a solid red line on several H-R diagrams.
Theoretical evolutionary tracks agree with the observed mass-luminosity relation:
The most massive main-sequence stars are the most luminous.
The least massive stars are the least luminous.
Thermonuclear Fusion and Fuel Consumption Rates
Energy emitted by stars is primarily generated by thermonuclear fusion.
More luminous (brighter) stars generate and radiate more energy, consuming fuel more rapidly.
Higher-mass stars consume fuel so quickly that they spend less time at each stage of stellar evolution than lower-mass stars:
O stars consume all of their core hydrogen in only a few million years.
Very low-mass stars take hundreds of billions of years to convert their cores from hydrogen into helium.
The universe is roughly 14 billion years old, meaning no main-sequence star with mass less than about has yet moved into the next stage of stellar evolution.
Duration of the Main-Sequence Stage
The conversion of hydrogen into helium in every star's core takes a long time compared to any other stage of its stellar evolution.
This is why the vast majority of stars represented on an H-R diagram are located on the main sequence.
Question Regarding Visible Stars
An intriguing question arises: While most stars are on the main sequence, why are most of the stars visible to the naked eye non-main-sequence stars?
Because stars with mass less than and stars with mass more than evolve beyond the ZAMS so differently, we explore their evolutionary stages separately.