SDS PAGE Analysis
Data/Results:
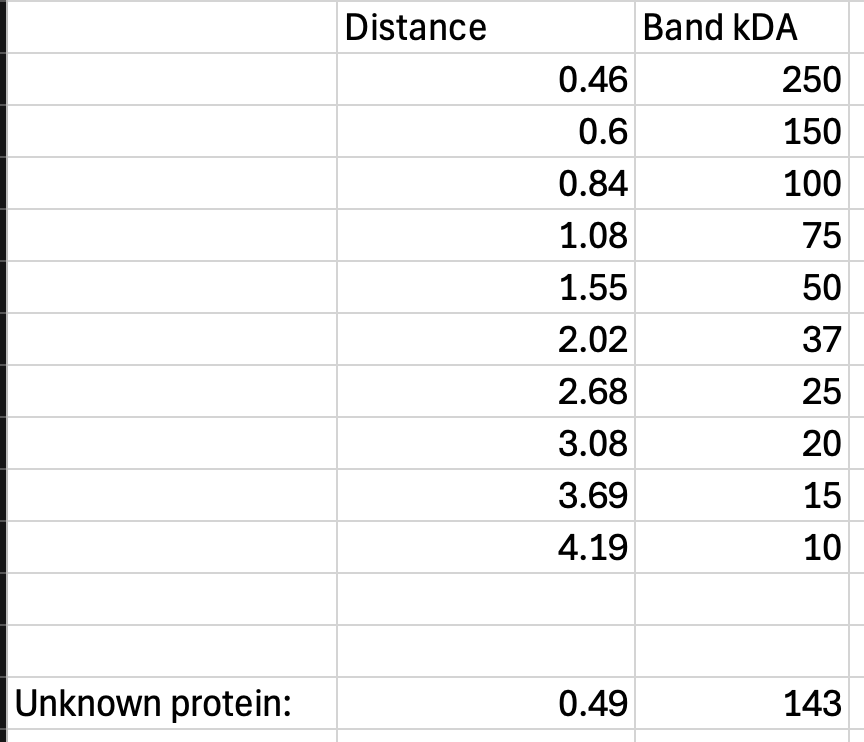
Table 1. Distance and Chart data for Marker Bands
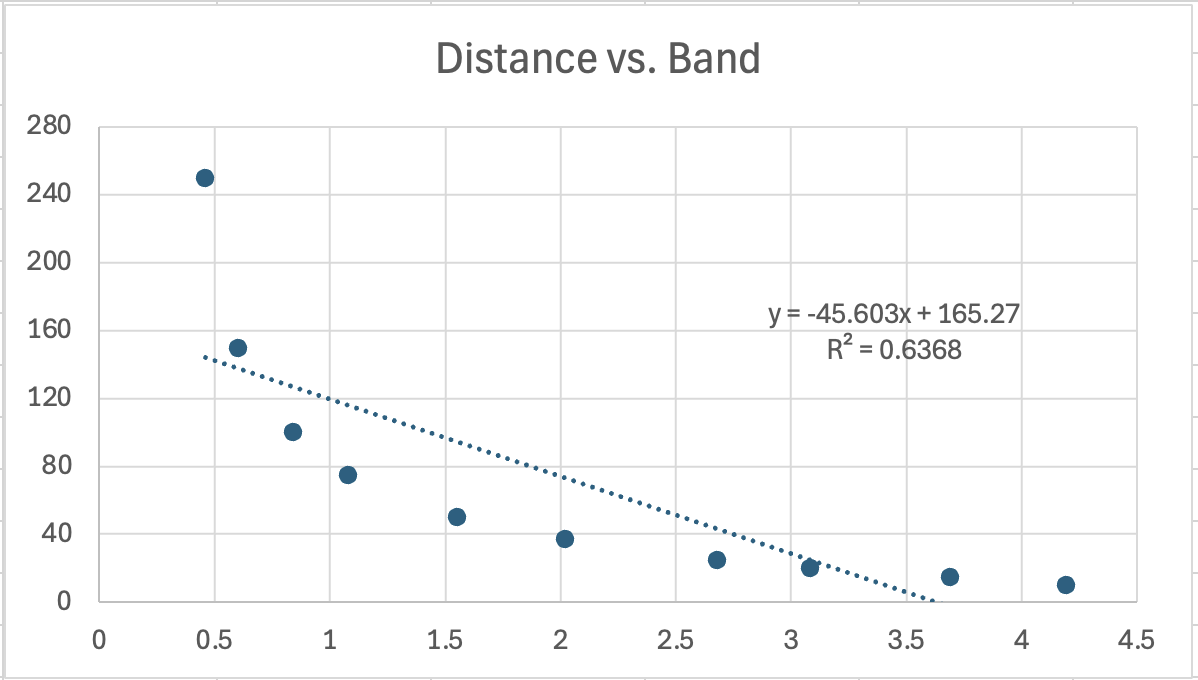
Graph 1. Distance vs. Band Size for Marker Band
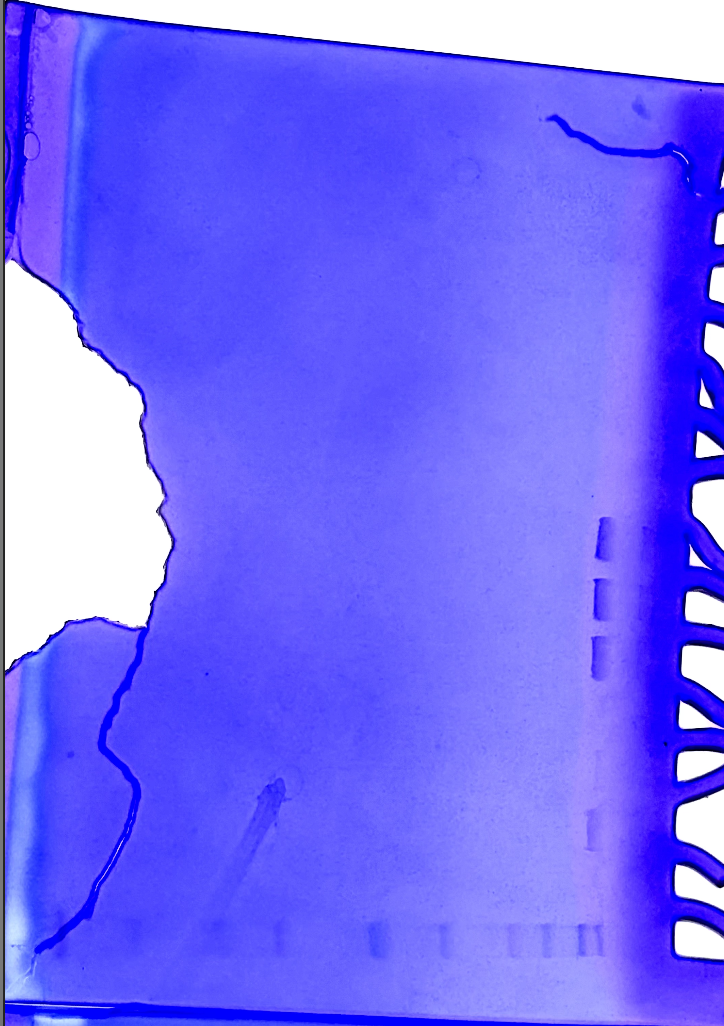
Photo 1. Successful Gel electrophoresis
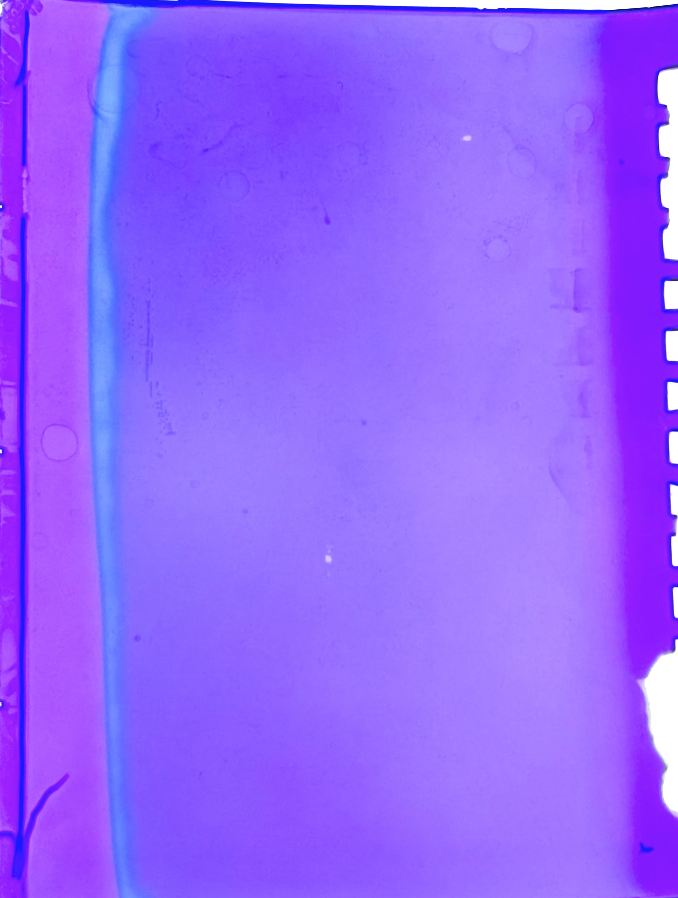
Photo 2. Unsuccessful Gel Electrophoresis
Explanation of Data/Results:
The imagine of photo 1. successful gel electrophoresis was uploaded Microsoft powerpoint where the line tool was used to measure the distance of each band. Each line of the marker bands going down correlated with the weight of the band, 250kda going down. Therefore the distance vs band size was plotted on a scatterplot and a line of best fit was generated along with the equation. Each dilutions band, dilutions 1 through 7, is measured and an average was obtained of the unknown protein distance. Using the equation y = -45.603x + 165.27, the distance of the unknown protein .49 was plugged in as X in order to generate the size of the band. This generated 142.9kDA
expected vs obtained results:
What was expected form this experiment was that the commassie dye was going to bind to the protein and leave a clear distinct stain in the gel that shows the migration of the protein. The size of the protein also was going to be shown through the migration based on how far it traveled down the gel. If the protein is smaller it will travel farther down but if it is bigger it will stay more towards the top. The first gel well band as well was expected to not be seen. The first gel well should not a ban due to it not containing any protein.
From our original experiment seen in the Photo 2. Unsuccessful Gel Electrophoresis, the marker bands were not seen. This is due to human error from forgetting to load the marker onto the gel well. Another error is seen from faint bands in the gel that could be due to improper loading technique as well as improper pipetting tips. The plastic pipetting tips were too thick therefore when pipetting, the gel walls separated too far and made the solution fall through the gel. A solution to these issues would be ensuring to load the marker, using thinner pipette tips, use a gel with bigger walls, and practicing pipetting techniques to avoid puncturing or separating the gel. In photo 1. Successful Gel Electrophoresis, as seen in the image there is a rip in the gel towards the bottom, although this didn’t impact data collection or the bands, there was improper removal of the gel from the apparatus and placing onto a tray that resulted in ripping. To avoid this in our next experiment, we could be more cautious when seperating the gel from the apparatus and ensure that there is complete seperating before placing on the tray to avoid the risk of ripping the gel and impacting the bands. Although in both Photo 1. and 2. both gels did not have a band in gel well 1 meaning that there was no protein which aligns with the expected results. The commassie blue dye as well was able to bind and stain both gels bands regardless of intensity.
Discussion:
The goal of this experiment was to use SDS PAGE techniques in order to determine the size of unknown protein 3. The SDS detergent was used to seperate and denature the unknown protein in order to be used to determine the molecular weight. Then the unknown protein is placed on a gel electrophoresis to be separated by weight.
As stated from the protocol, we hypothesized that the unknown protein would be identified through SDS method and comparing the migration band of the unknown with the molecular weight marker. In the original experiment, the hypothesis was not proven or disproven due to human error that did not load the molecular weight marker. Although in the sucessful experiment that hypothesis was proven. The identity of the unknown protein was able to be determined thorugh a sucessful SDS run and through comparision of the molecular weight marker.
There were two controls used in the experiment. This involved the molecular weight marker itself and the blank dilution. The weight marker was used to determine the unknown proteins band size by comparing to the migration of the molecular weight marker. The other control, the blank dilution 1, was pipetted into the first gel and therefore showed no band. The controls were successful in allowing to determine the unknown protein’s identity.
The results showed the weight of each band in the molecular weight marker. This was used to make a graph comparing band migration distance and the band weight. This was then used to generate a line of best fit and generate the equation y = -45.603x + 165.27. the band migration distance for the unknown protein was measured and plugged into the x in the equation to generate y which is the band size. The unknown protein’s size is calculated to be 114kDa.
it is to be believed that unknown protein that weighs at a round estimate of 114kDA is B-Galactosidase from E.Coli. This is due to the protein itself being a tetrameric protein weighing at 465kDA, but each subunit is 116kDA which is extremely close to the unknown protein. When B-Galactosidase from E.Coli goes through the SDS method, the tetramer is denatured and the subunits are separated therefore this shows a strong indication that unknown protein 3 is a tetramer. Apart from that it would only show one distance band in each well because all subunits are the same weight, 116kDA. Another possibility was that the unknown protein 3 is Myosin, Calcium activated from rabbit muscle. This is was also a possibility because the heaviest chain is 200kda and the lightest chain is 20kDA, 200kDA was also close to 114kDA but not as close as 116kDA from B-Galactosidase. Another indication that it is not myosin is because there should have been two bands in the gel around the 200 and around the 20kDA and only one is present in the gel also pointing signs to the protein identifying with B-Galactosidase.