L1- Overconsumption
The Anthropocene
the idea that human activities are pushing the Earth system beyond the range of natural variation (that was observed in the Holocene- operating outside the ‘safe operating space of humanity’)
the Earth System→ all components of the Earth interacting with each other in a non-linear, complex way
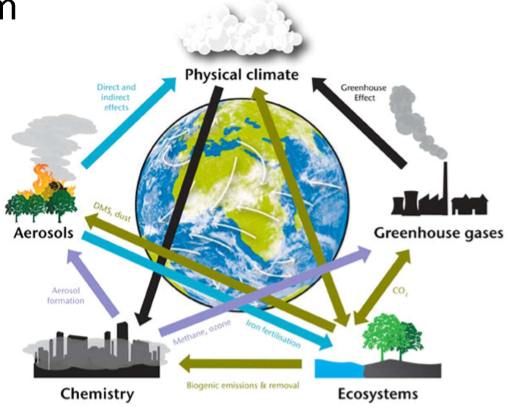
humans are a global geophysical force in this system→ are pushing it in a way it wouldn’t go without us
the term has cultural significance→ an informal term for human impacts on the planet
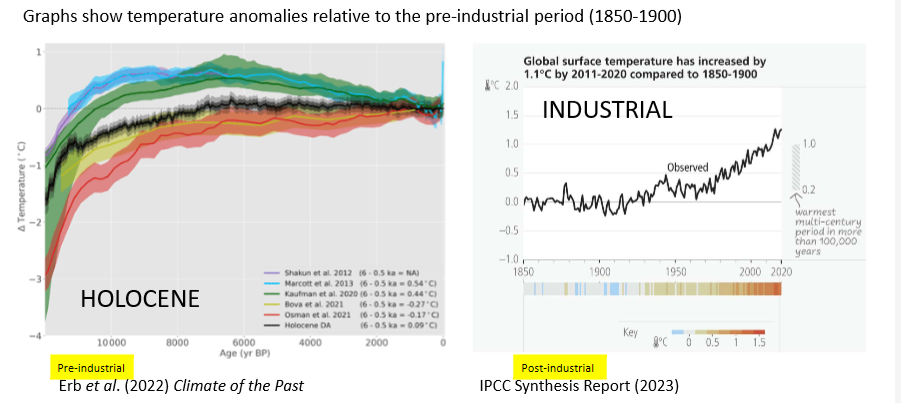
Temperature
pre industrial revolution→ general warming trend, cooling periods, no more than 0.5 degree increase
post industrial revolution→ more than 1 degree increase in last 100 years, last year average temperature was 1.5 degrees above the pre-industrial baseline
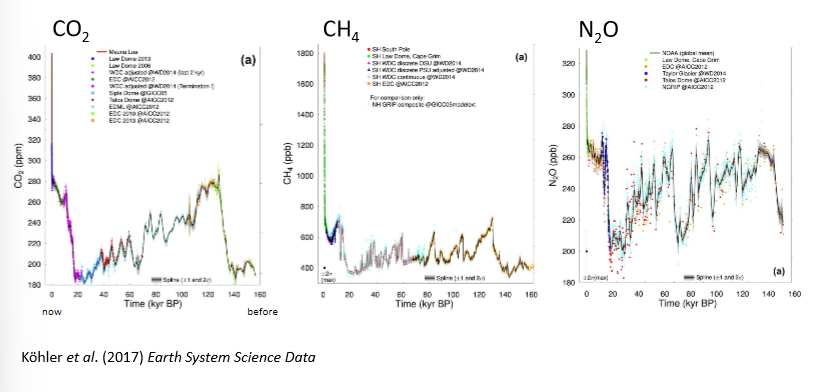
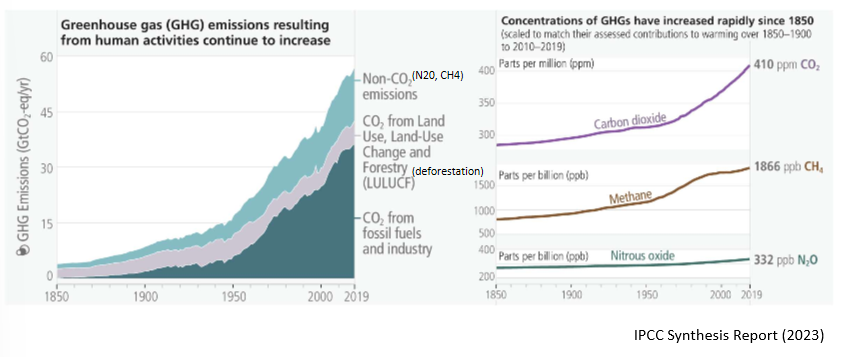
Greenhouse Gas Emissions
graph shows an entire Ice Age cycle- variation throughout the Holocene, 20,000ya was peak ice, high during last interglacial
current- rapid increase, now at 420ppm CO2, same trends for methane and nitrous oxide
breakdown of where CO2 is coming from→ during the last century, the main increase in GGH emissions is from fossil fuels and industry, uptick after WW2
Human impacts predate modern human species:
ancient fire and hunting→ mass extinctions
origin and spread of agriculture→ land-use
european colonisation→ resource consumption, way labour is used
industrial revolution→ increased fossil fuel use
great acceleration→ since 1950, global economic system
Why does this history matter?
attribution→ what caused this?
mitigation→ what is needed to address the problems?
responsibility→ who should lead the mitigations?
British Industrial Revolution-
started in 1800, Sheffield was the heart of the IR
was at the same time as:
machines replacing labour
transitioning from agriculture to machine economies
urbanisation
improved sanitation/healthcare→ population growth
historical emissions were dominated by US and EU but are now dominated by China:
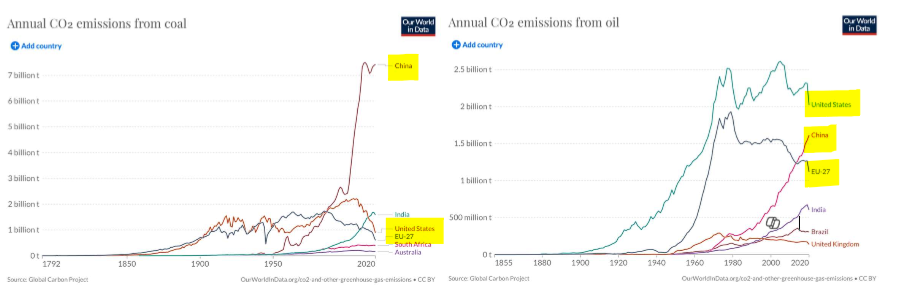
US and EU were the first emitters in the 19th-20th century, other countries have followed, China has huge emissions now
US was a big burner of oil during the 20th century, followed by the EU and more recently China
Post-industrial development:
transition to a service-based economy in rich countries:
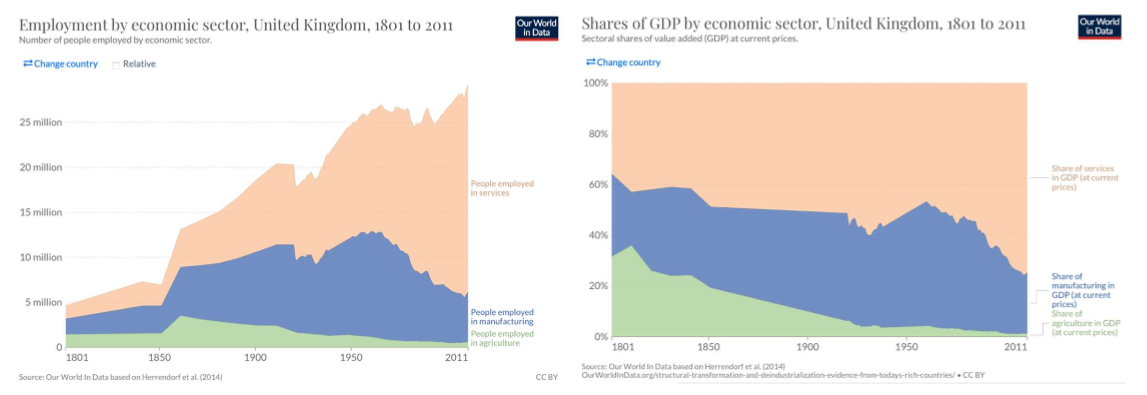
decline in agriculture as machines appeared, increase in manufacturing during the IR, rapid decline, expansion in services
same can be seen in share of GDP (economy)
LINK TO BLOG POST
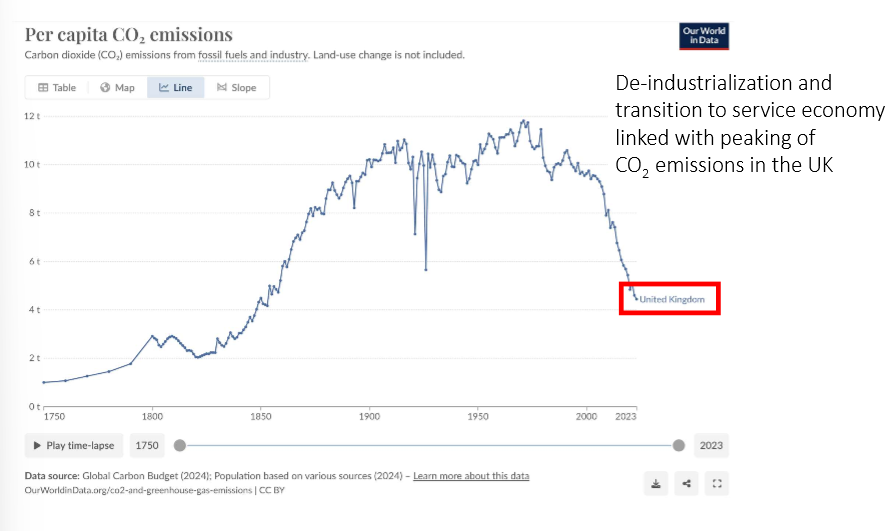
has led to reductions in CO2 emissions in the UK:
mitigation policies:
decarbonising the UK grid:
less than 1/3 of electricity was generated by fossil fuels in the last 12 months
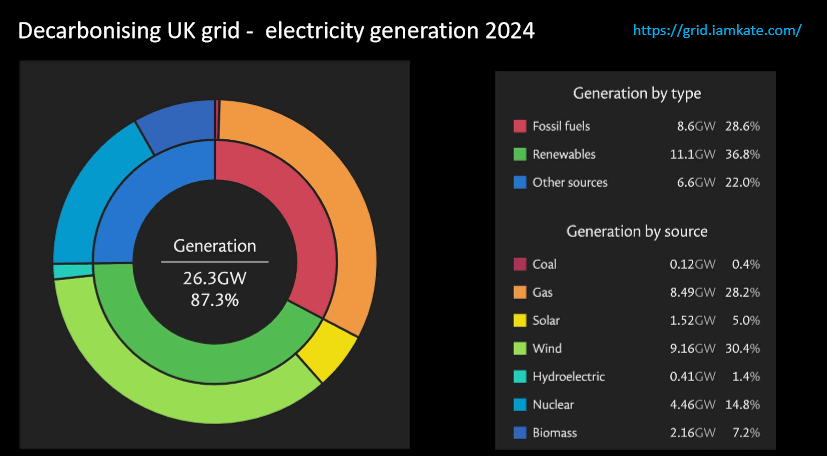
target by 2030, is happening quickly
last UK coal power station closed in 09/24
most are built in China/India now
CO2 emissions per person per country show that even though UK emissions have halved, they are still 2x India, and India are starting to increase like an IR
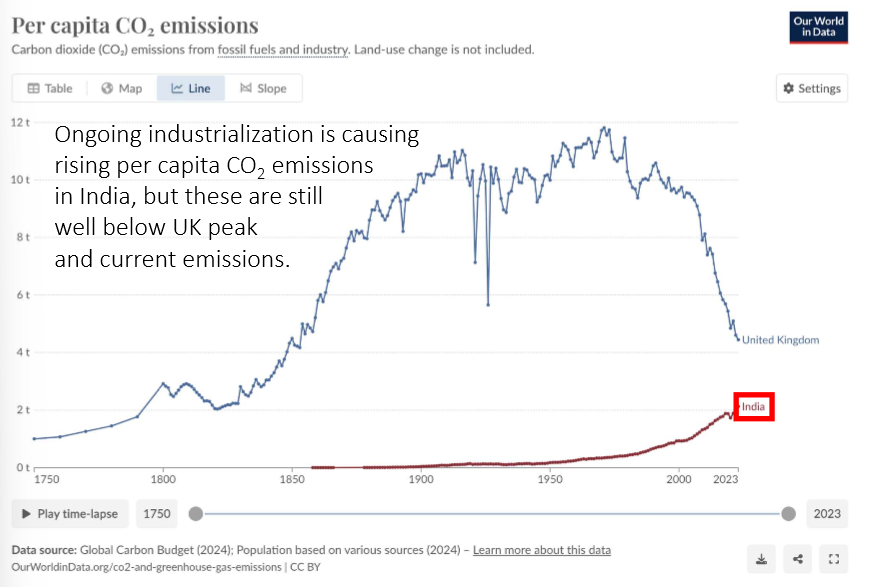
geopolitics→ COP26 pledge to quit coal, India and China have slowed down in their target, India having their own IR
understanding the historical context allows us to understand the present situation
historical contribution of CO2 emissions→ most of all emissions comes from early industrialising nations (NA, Europe, Japan, Australia= 66%)
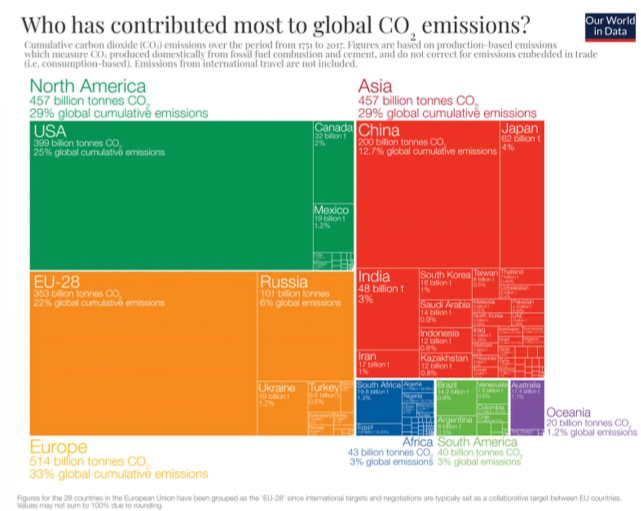
→ is important as all GHG in the atmosphere determines warming
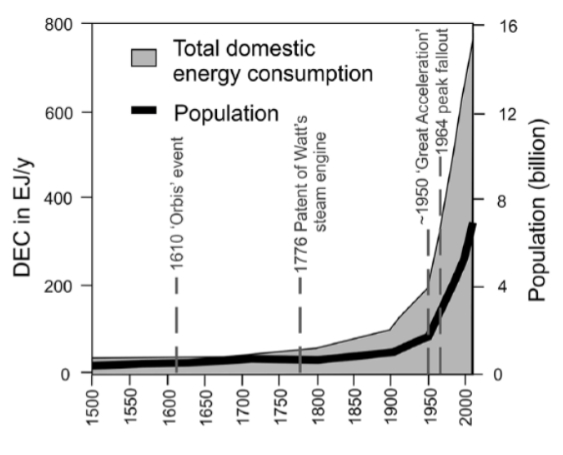
The Great Acceleration:
all factors are increasing in the same way since 1950 and are linked together e.g. McDonalds growing in same pattern shows a globalised economy
after ww2 by today’s wealthy countries
rapid economic growth
cheap fossil fuels
natural resources
global expansion of farmland
analogy between capitalism and the Anthropocene:
size of country’s economy (GDP) correlates with the amount of CO2 it emits (energy consumption)
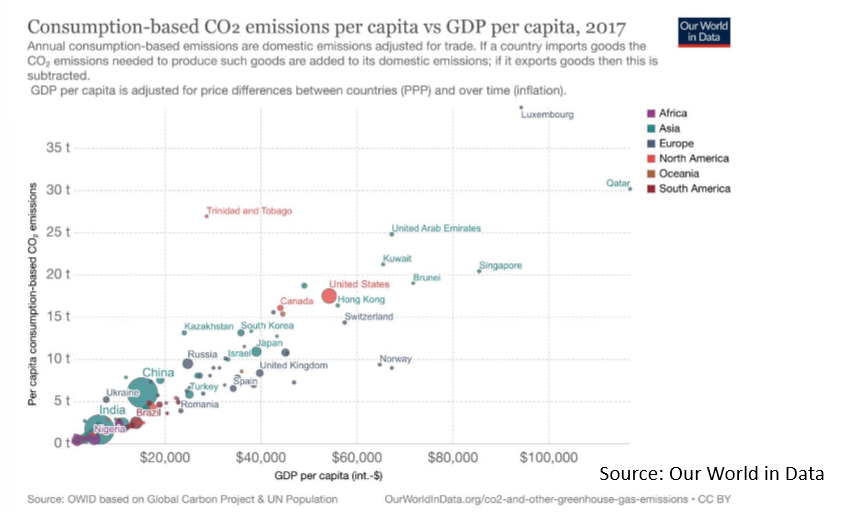
there are huge inequalities within and between countries in terms of wealth and CO2
46% of wealth controlled by the richest 0.7%
97% of wealth controlled by the richest 30% (>$10,000 household wealth- 92% of British households)
wealthiest 1% have the same CO2 emissions as the poorest 66%
more CO2 emitted in 4 days by one person in the US than by a person in the whole year in poorer countries
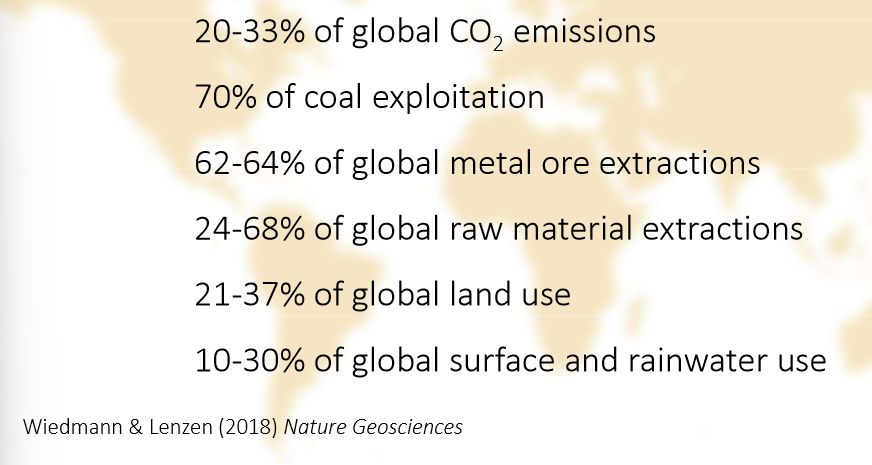
urbanisation is important in this:
> industrialisation = > urbanisation = > economic productivity = > energy/resource consumption
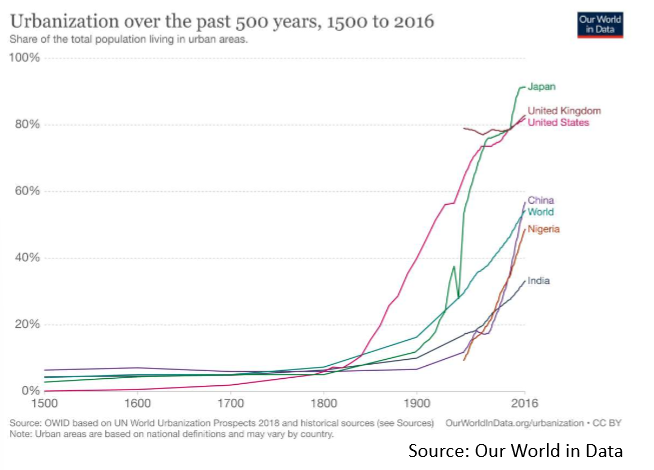
there is a relationship between wealth and urbanisation:
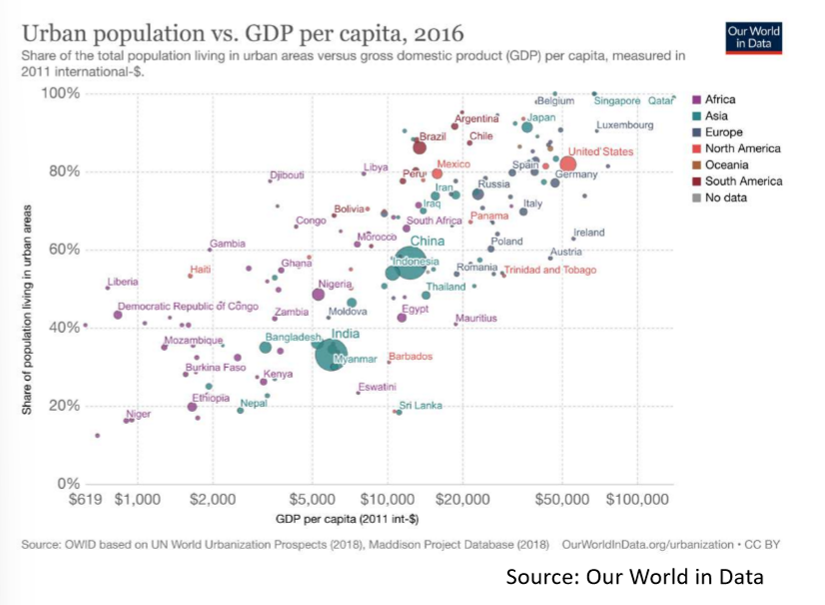
urbanisation is more recent for most countries and is associated with IR
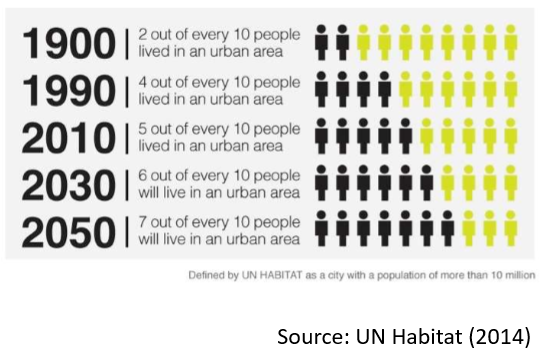
urbanisation is predicted to increase:
Global Trade:
huge increase since WW2 (260x more flow of goods)
as production shifts around the world, environmental damage shifts too (from global North to China/ global South)
unequal distribution of wealth causes power imbalances→ parallels with colonial power relations- could be neocolonialism
environmental damage embodied in international trade→
models add up ED caused by production/supply chains for every product
is used to measure Scope 3 emissions
Scope 1→ direct emissions e.g. boiler
Scope 2→ electricity e.g. a grid
Scope 3→ embodied in goods
large amount of ED is embodied in goods in trade when looking at all products worldwide
shifting production to less developed countries increases overall ED as they usually have more intense manufacturing
Some environmental impacts embodied in IT:
complexity of global supply chains makes it hard to mitigate the ED from manufacturing e.g. palm oil
is hard for consumers to do much
mitigation needs to be by governments of production, certification of palm oil, pressure groups
Importers of embodied CO2 from trade→ US, Europe, Brazil, Canada, Mexico
Exporters of embodied CO2 from trade → China, India, Russia, SA (LIC)
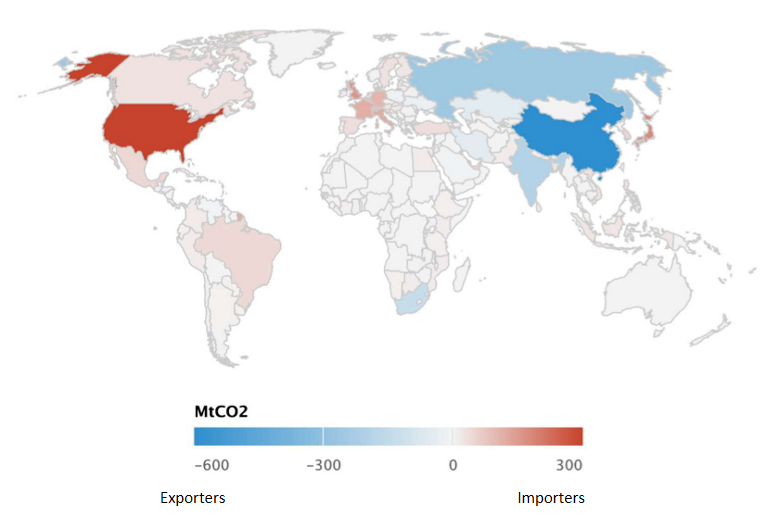
How does exportation work e.g. China:
is a net exporter→ high embodied emissions, are larger than Japan/Germany, coal-based energy, but emissions are in particular provinces
→ regulation on particular areas can be effective
had a peak in 2008, fell since the global financial crisis, possible carbon leakage by moving exportations to LIC countries
China’s Belt and Road Initiative-
investment by Chinese government in infrastructure in other countries with associated economic connections
mainly across Eurasia and Africa, revived ancient Silk Road trade routes
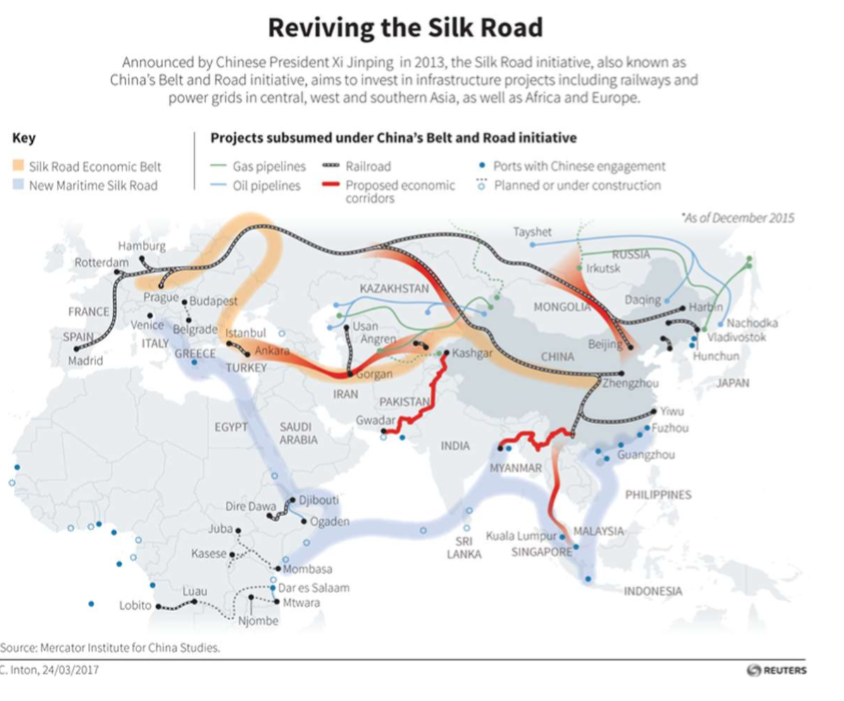
roads, railways, telecoms, ports, energy pipelines
now lots of manufacturing has moved to BRI nations-
half of global CO2 emissions come from BRI nations
most of the CO2 increase in the last 20 years have been associated with this initiative
carbon leakage
Summary:
Industrial and consumption-based CO2 emissions have pushed the Earth System outside its natural Holocene range of variation.
CO2 emissions arise primarily from consumption by globally wealthy, industrialised urban populations (in cities across the world).
The primary cause of CO2 emissions is consumption of energy and goods by wealthy, urban societies.
Cumulative CO2 emissions have arisen predominantly from early-industrialising western countries, especially the USA and in Europe. In the 21st century, emissions are shifting to Asia, centred on China.
Export accounts for a significant fraction of Chinese emissions. However, consumption by industrialised urban populations across Asia and the Global South are becoming increasingly important.