Biol 414 Exam 2
Population Distributions and Abundance
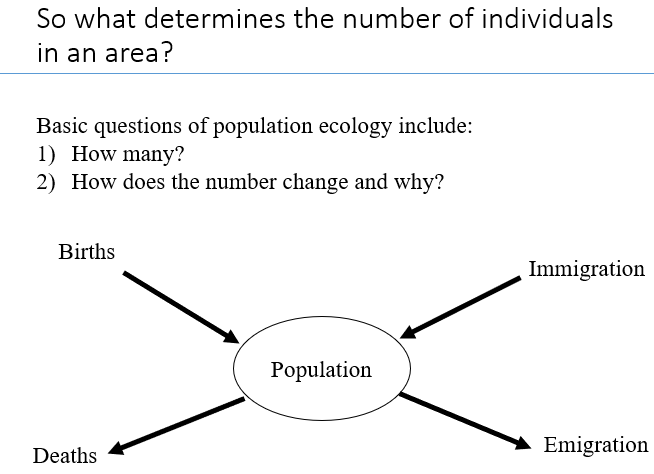
Population – A group of individuals of a single species inhabiting a specific area
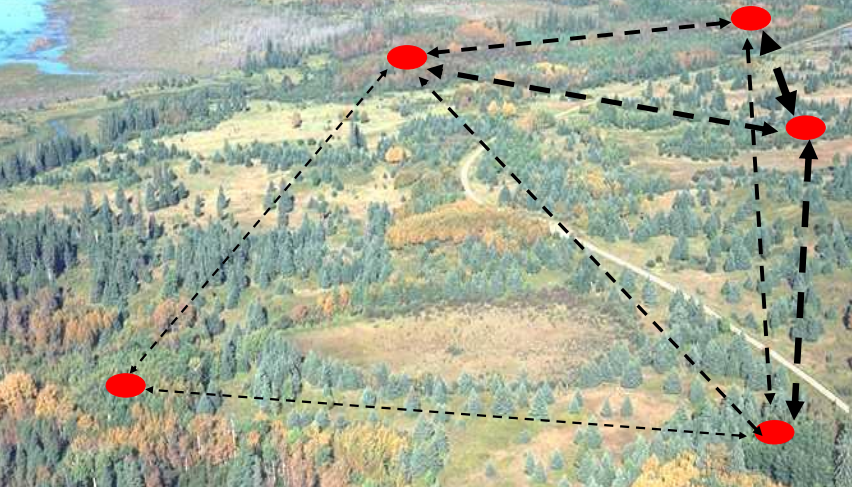
Meta-population (I2) – Group of sub-populations living in separate locations that have some level of active exchange of individuals
 Global population – Entire set of populations on Earth for a given species, specified by geographic range
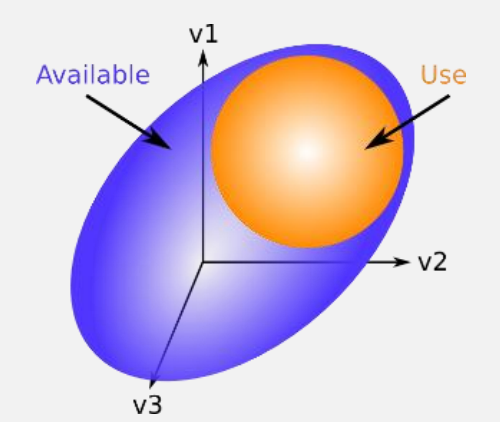
Fundamental Niche – Total range of abiotic conditions under which a species can survive.
Realized Niche – That portion of a species’ fundamental niche that can be occupied in the presence of other species (competitors, predators etc.)
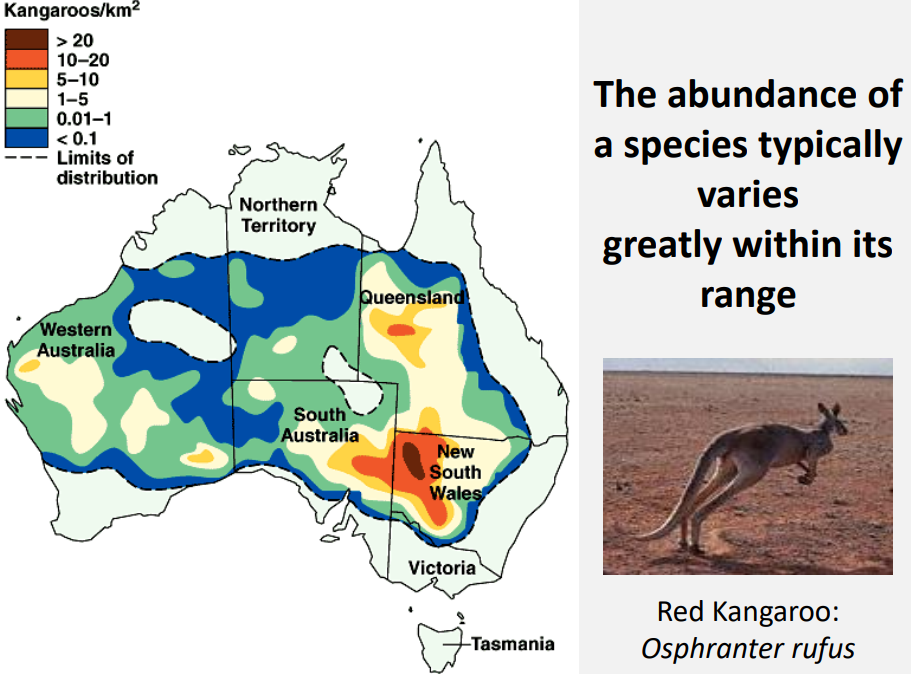
 Populations are dynamic in space and time, large amount of variation in range size among species
Some species occupy large range while some have small ranges
Most species have small ranges, very few have large ranges
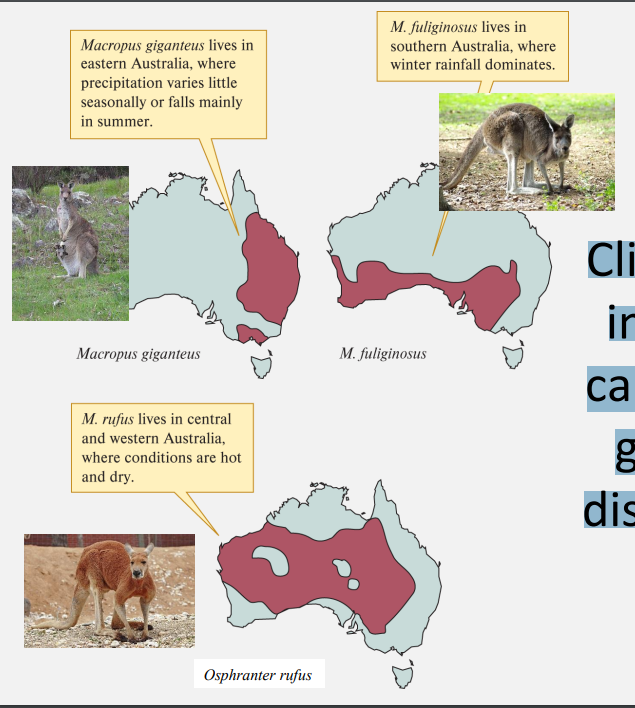
Climate-niche interactions can shape the geographic distribution of species
Spatial changes in abundance important to industries such as fishing
Often debate over how to define wild populations (sometimes done based on human boundaries which can pose challneges acorss state or country borders, see butternut example in slides [34, file:///C:/Users/Sophie/Downloads/UnitH-PopDistAbund_2023_final.pdf ])
Abundance is measured as density (#/area)
Population may be clumped, random (rare), or uniformly distributed
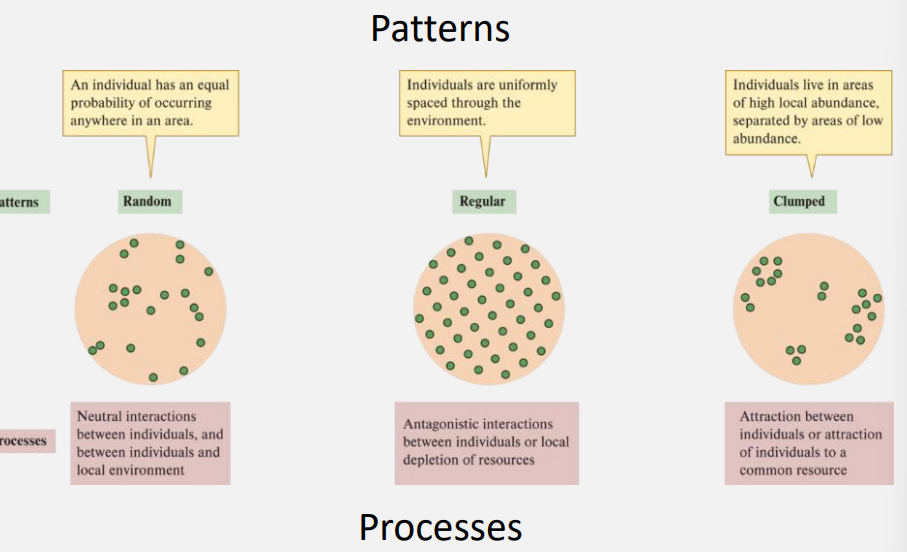
Uniform distribution maintained by competition
Clustered usually occurs when foot or habitat are clustered and can also be caused by social behavior
At larger scales (across broad environmental gradients), most populations are clumped
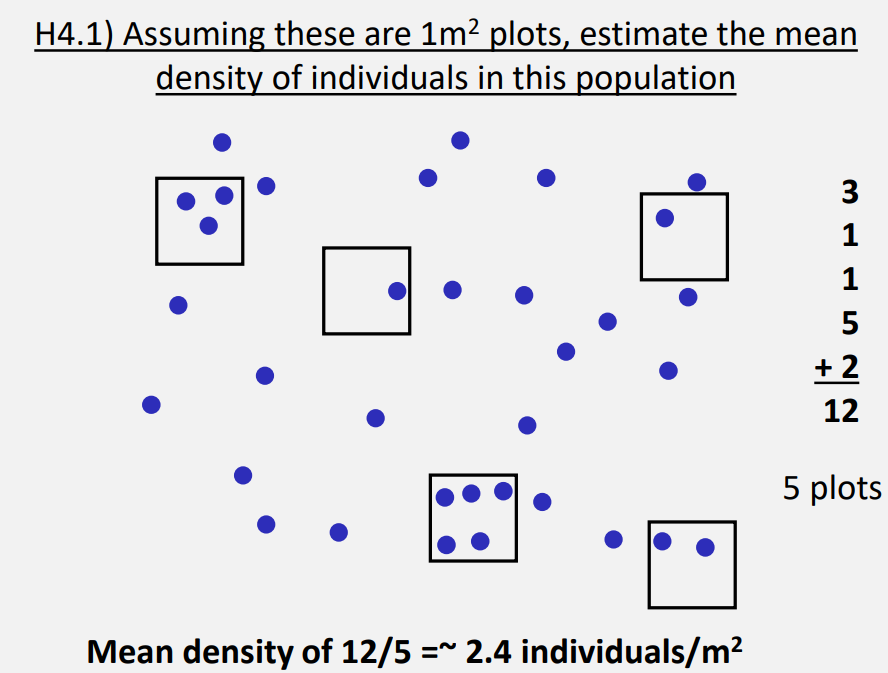
Local population density (N) - number of individuals per unit area (#/m2 ; #/hectare; #/acre; #/square mile)
Density estimated by sampling a population - Fixed area sampling - Plot-less sampling - Mark-recapture methods
-Fixed Area Sampling (Quadrat sampling) – A random sample of 1% of the total area can often provide accurate estimates of density (as long as quadrats are distributed randomly)
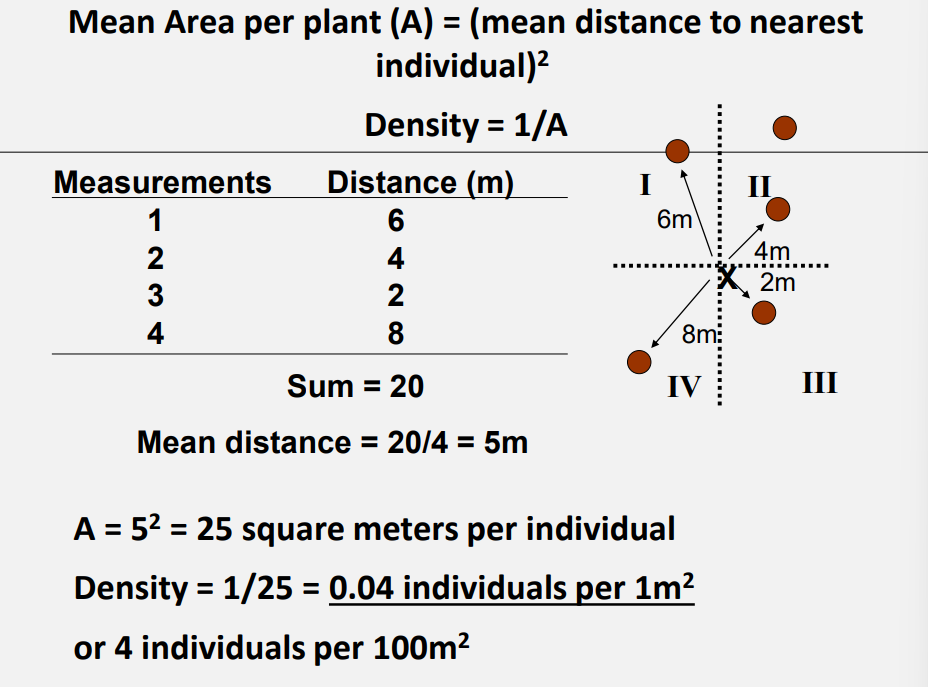
Plot-less sampling (nearest-neighbor/individual) – estimates density by measuring the distance from random points to the nearest individual (or between individuals).
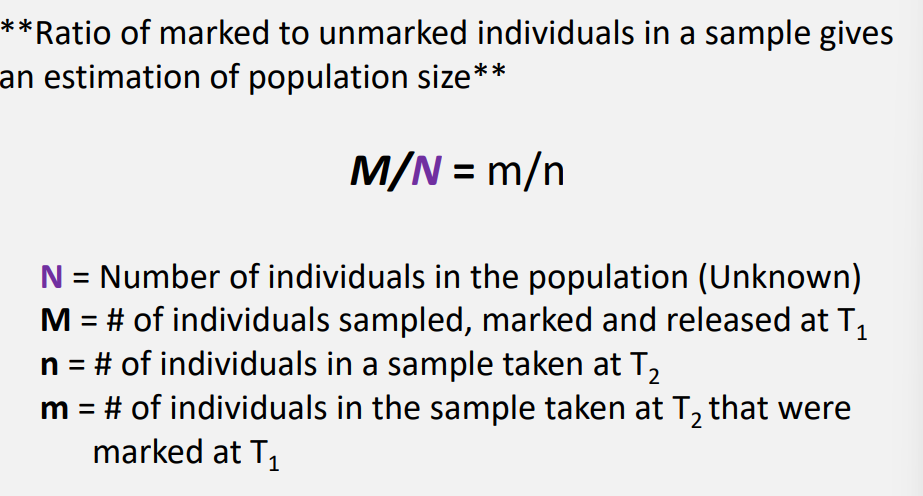
 Mark Recapture
Population Dynamics
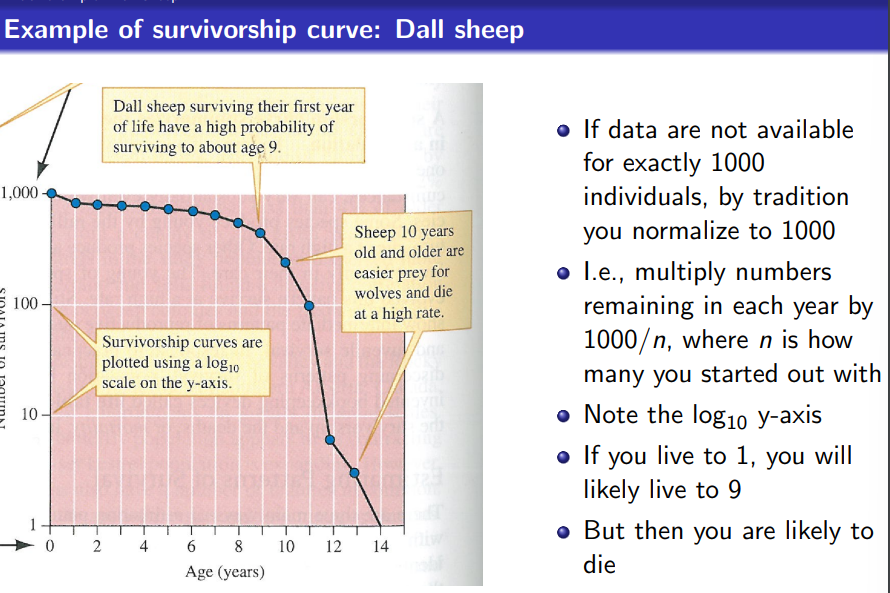
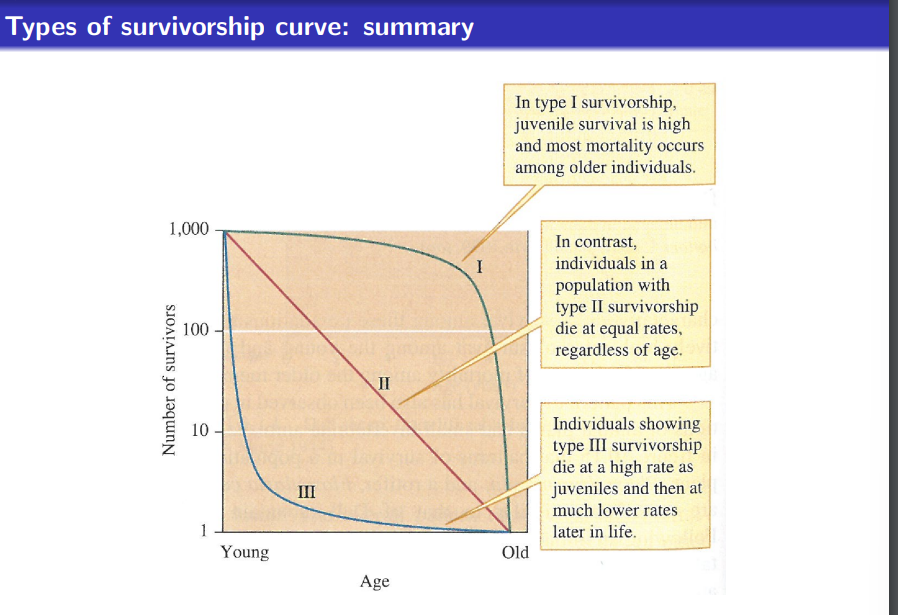 Number of survivors on survivorship curve must be on a log scale
Variants of survivorships cuvces not on log scale can tell other information but can not be classified as type I, II, III
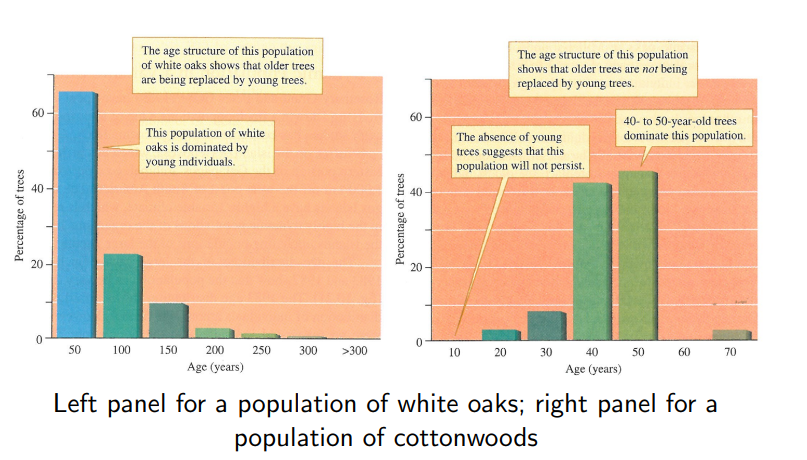
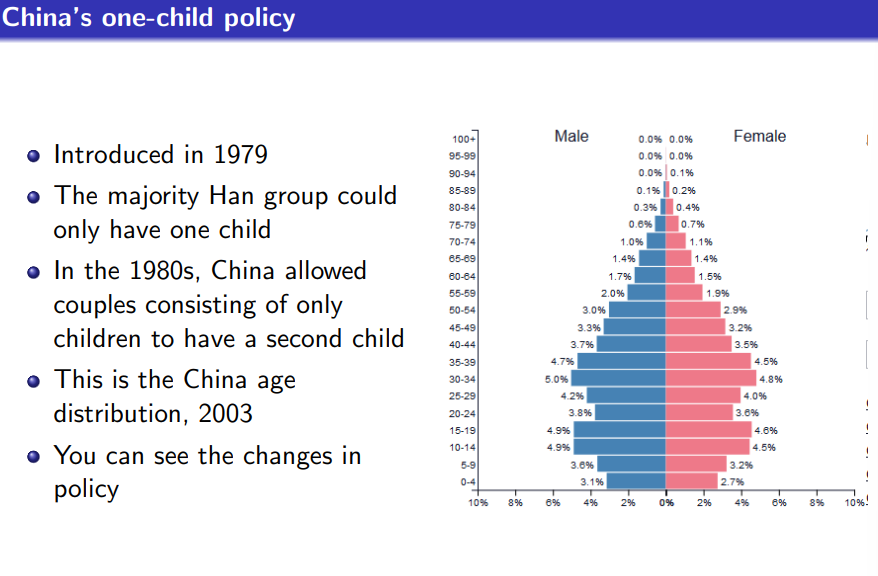
An age distribution is just a snapshot of the distribution of ages in a population. It gives different but related information compared to survivorship curves
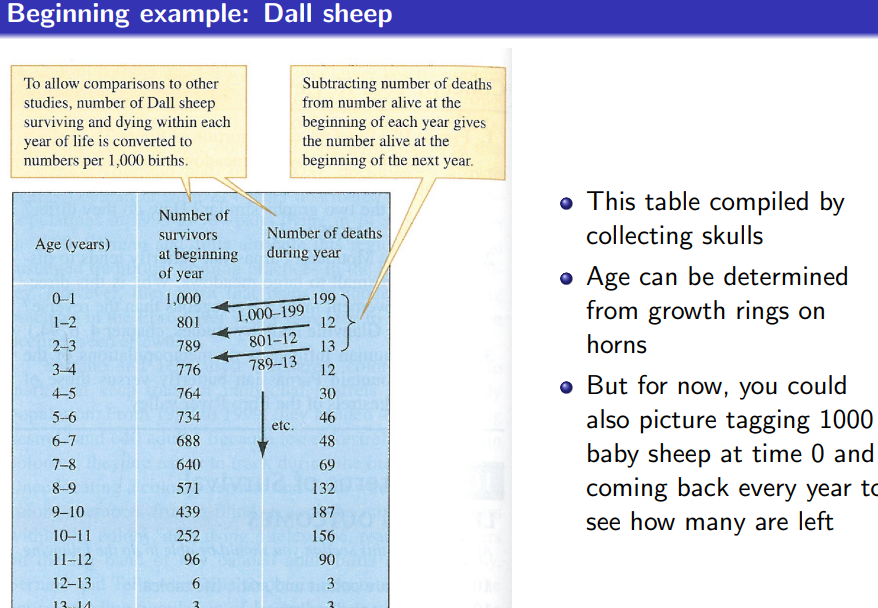
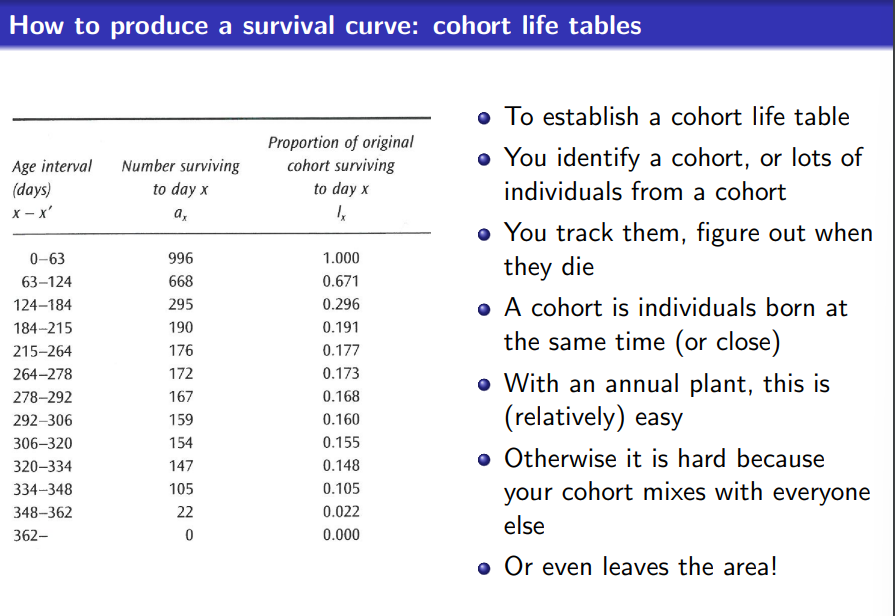 Easy to make cohort tables for annual or sessile species, harder for other species such as those that move around
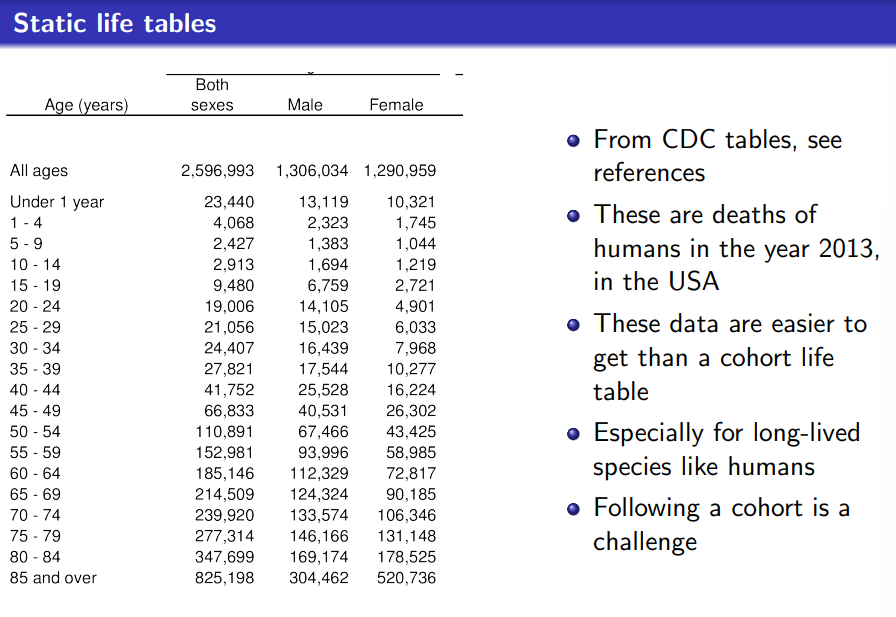 Can get approximate survival curve from static life table if population is stable and there is a stable age distribution (not often the case in practice)
Fecundity schedules: track reproduction rates for different ages or stages (cohort and static versions)
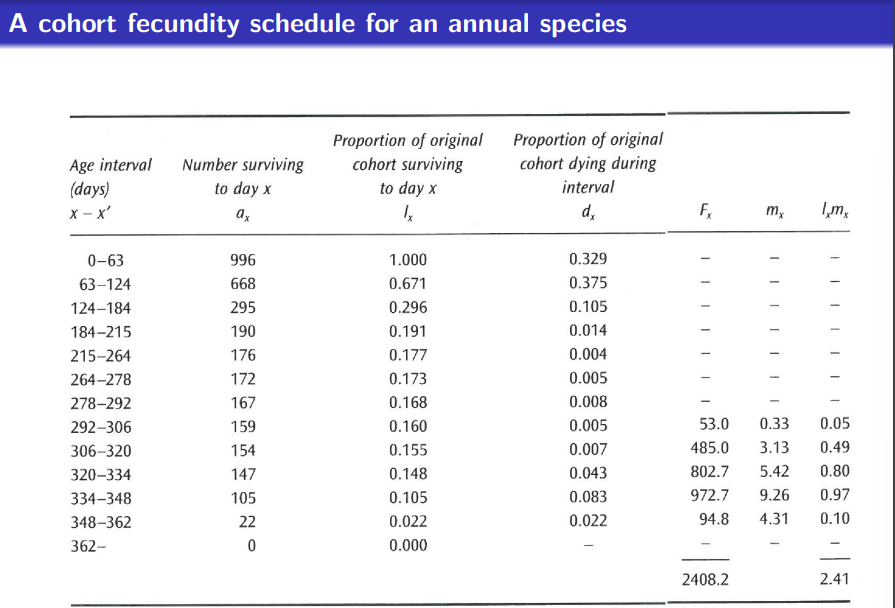
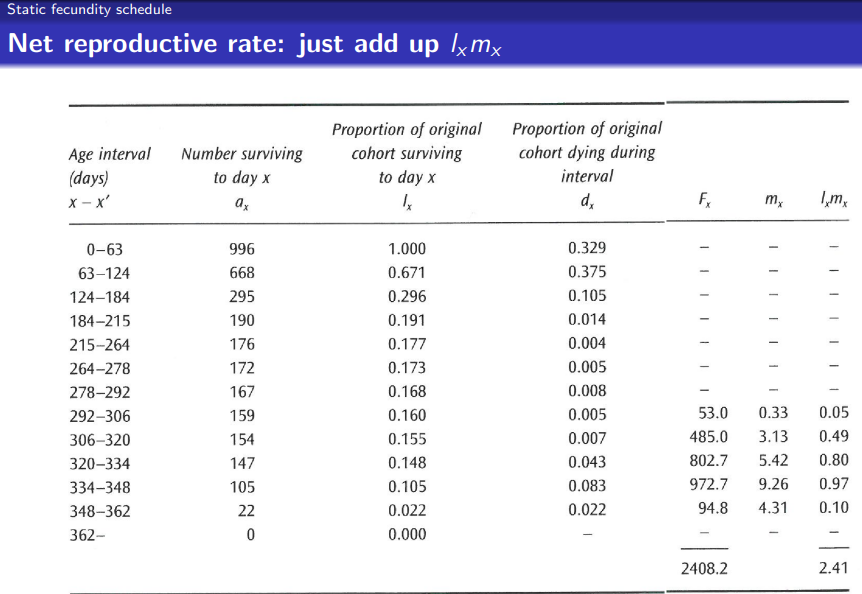 Net reproductive rate: Average number of offspring produced per individual. When this is greater than one, the population is growing. When this is less than one, the population is shrinking. This assumes a stable age distribution
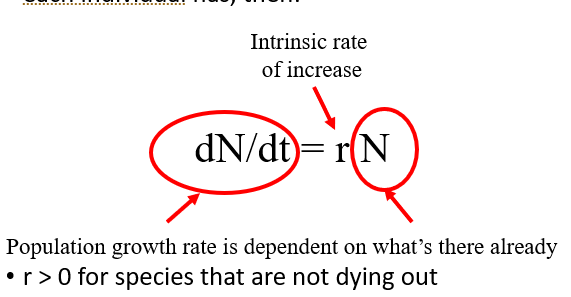
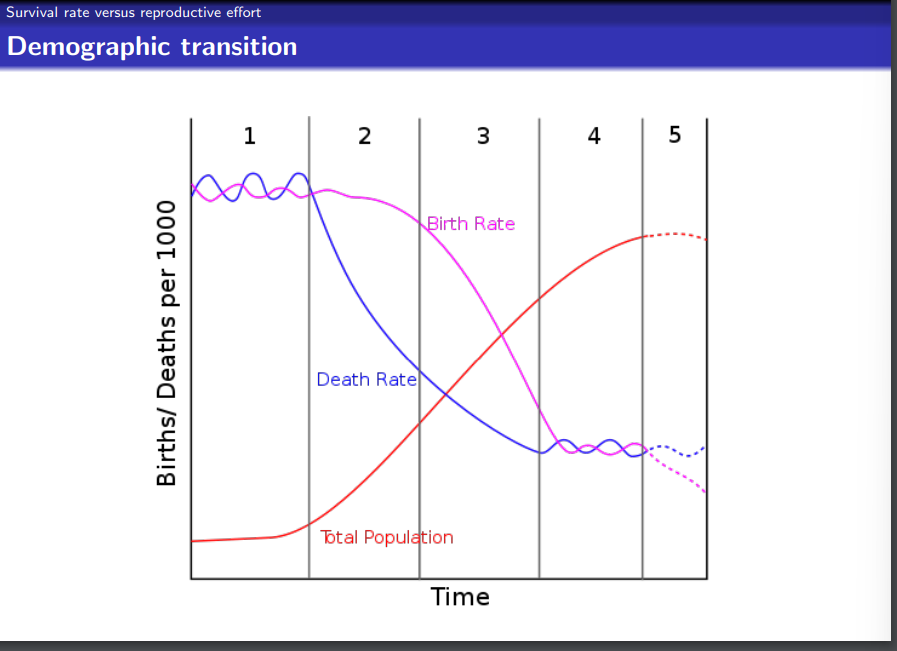
Population Growth


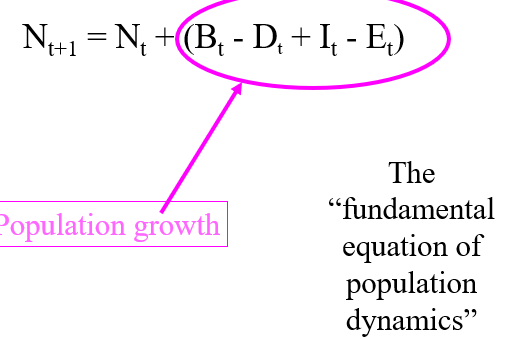
Exponential Growth
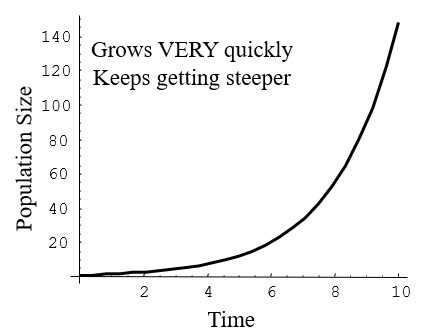 Exponential growth is not the norm, factors that limit this are weather/environmental variation, lack of food/essential nutrients/water, lack of space/light, diseases/parasites, and predation
Many of the factors are related to population density

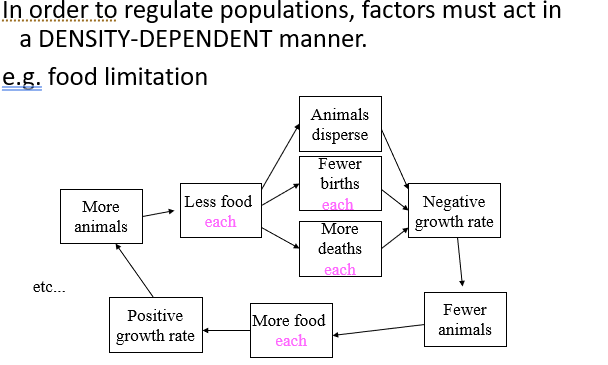
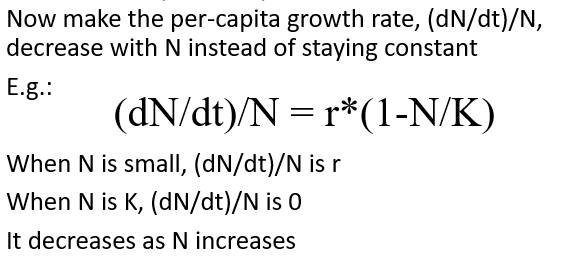
Density dependence is when a per capita rate changes with density
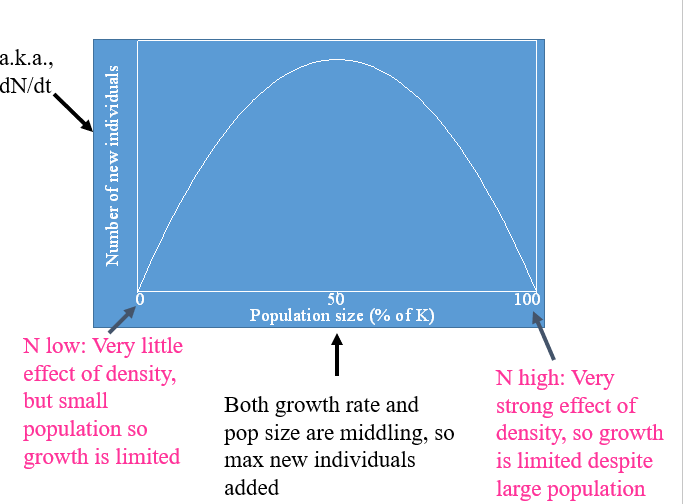
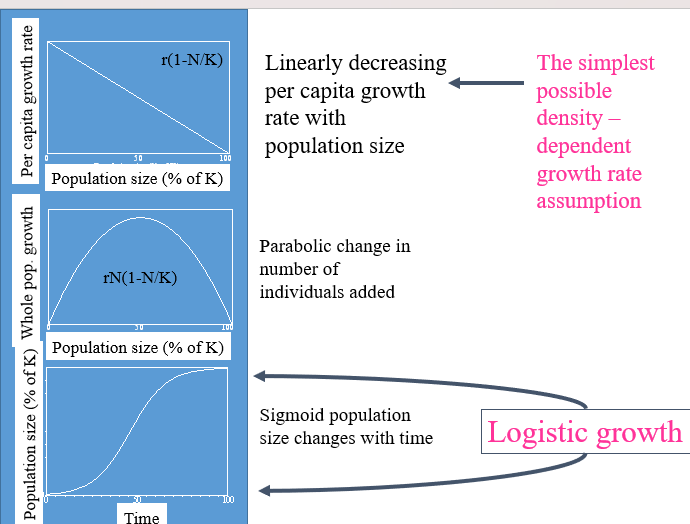
Logistic Growth-
Population Life Histories
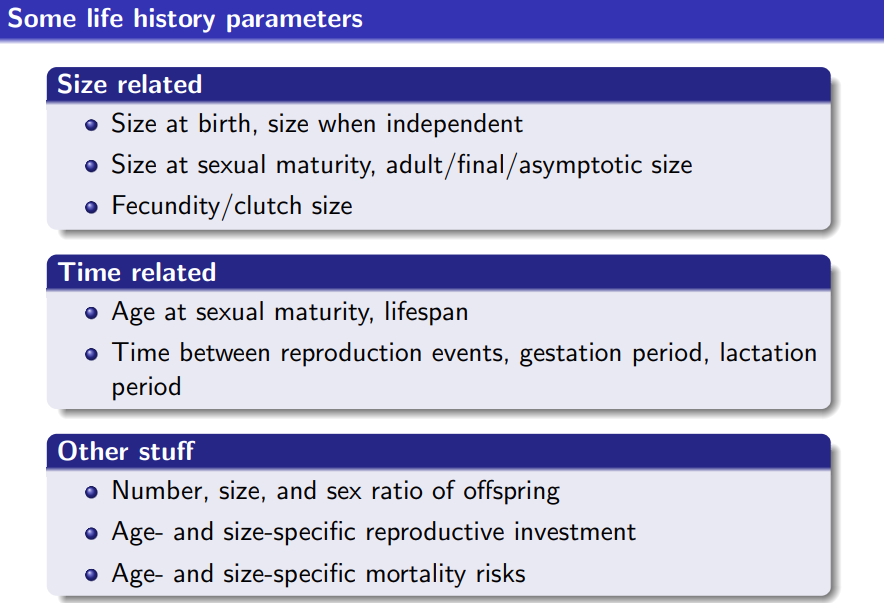
Organisms vary in life events, aspects of reproduction, and size/various rates
Life history: The major features of the life cycle through which an organism passes, with particular emphasis on survival and reproduction. Features notably include but are not limited to sexual maturity, first reproduction, number of offspring and level of parental investment, and timing of senescence and death.
Life history theory: Branch of evolutionary ecology that tries to explain how life history has been shaped by natural selection
 See slides for examples, especially aphid example (file:///C:/Users/Sophie/Downloads/file%20(3).pdf)
There are trade-offs in life history as well (large or many offspring but not both, either work hard to survive or work hard to reproduce)
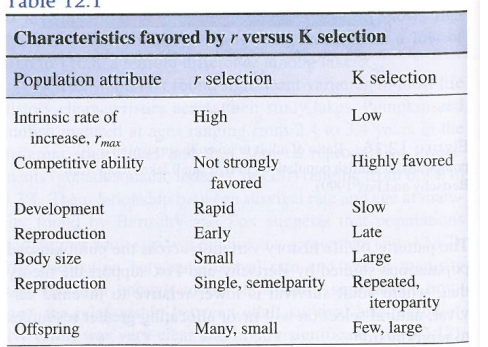
An “r-selected” species is one that is selected for its fast growth rate
A “K-selected” species is one that is selected for its ability to withstand competition
(an oversimplification but helpful terminology)
 Other classifications listed in book
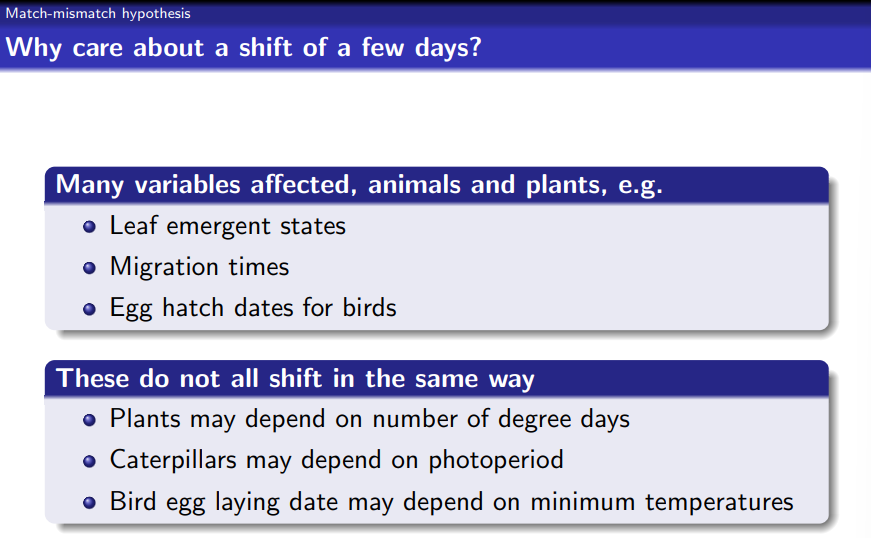
Phenology: the study of cyclic and seasonal natural phenomena, especially in relation to climate and plant and animal life
Many dates are getting earlier
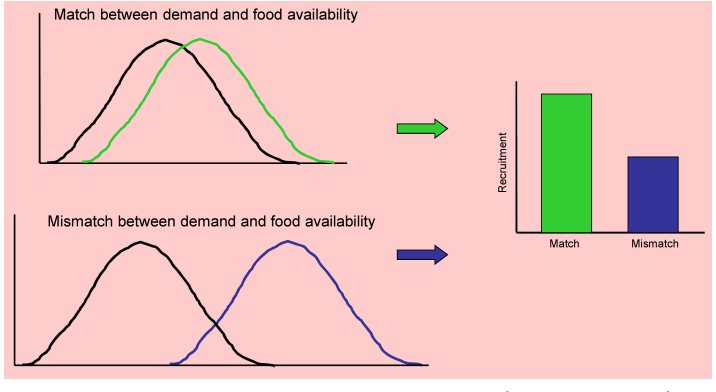
Mismatch Hypothesis