Ch 13 - The Rational Consumer:
I. Utility: Getting Satisfaction
A. Utility and consumption
1. The utility of a consumer is a measure of the satisfaction the consumer derives from consumption of goods and services.
2. An individual’s consumption bundle the collection of all the goods and services consumed by an individual.
3. An individual’s utility function gives the total utility generated by his or her consumption bundle.
B. The principle of diminishing marginal utility
1. The utility margin a good or service is the change in total utility generated by consuming an additional unit of that good or service.
2. The utility margin curve shows how marginal utility depends on the quantity of a good or service consumed.
3. The principle of diminishing marginal utility says that each successive unit of a good or service consumed adds less to total util- ity than the previous unit.
II. Budgets and Optimal Consumption
A. Budget constraints and budget lines
1. A budget constraint requires that the cost of a consumer’s consumption bundle be no more than the consumer’s total income.
2. A consumer’s consumption possibilities is the set of all consumption bundles that he or she can consume given the consumer’s income and prevailing prices.
3. A consumer’s budget line shows the consumption bundles available to a consumer who spends all of his or her income.
4. Every consumption bundle inside the budget line is affordable, while every bundle outside the budget line is unaffordable. How about the bundle ON the budget line?
5. The horizontal intercept indicates spending all income on the good on the horizontal axis, and $0 on the good on the vertical axis.
6. How to explain the slope of the budge line?
7. The consumption bundle that a consumer actually buys depends on the consumer’s income and the prices of the goods and services.
B. Optimal consumption choice
1. The optimal consumption bundle is the consumption bundle that maximizes a consumer’s utility, given his or her budget constraint.
2. An individual’s optimal consumption bundle is the one that maximizes total utility, and so puts the individual at the top of his or her total utility curve.
III. Spending the Marginal Dollar
A. Marginal utility per dollar
1. The Marginal utility per dollar spent on a good or service is the additional utility from spending one more dollar on that good or service.
Fill the numbers in the table.

2. MUc and MUp indicate the marginal utility of clams and potatoes, respectively.
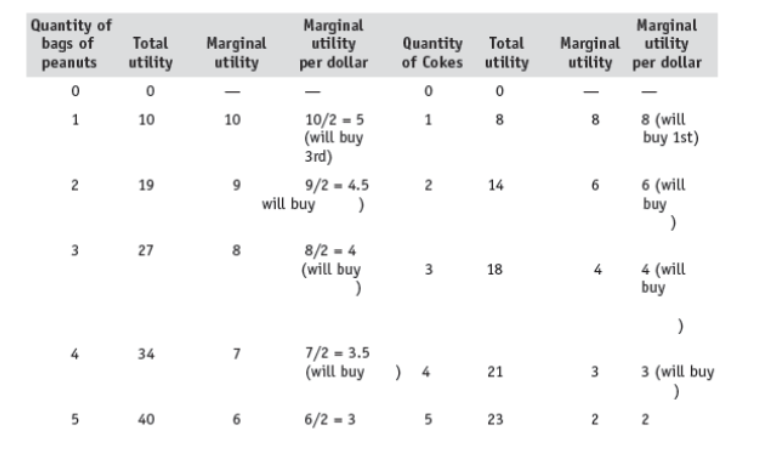
3. When deciding to purchase a good, a consumer weighs the additional utility to be derived from the good against the additional cost (price) of the good. Why? It’s the ratio of benefits and cost for spending additional one dollar. Assume that price of peanuts is $2 per bag. Fill numbers in the table:
4. The marginal utility per dollar of clams = MUc/Pc, and the marginal utility per dollar of potatoes = MUp/Pp.
B. Optimal consumption
1. According to the utility-maximizing principle of marginal analysis, the marginal utility
per dollar spent must be the same for all goods and services in the optimal consumption bundle.
2. In equation form, the optimal consumption rule for two goods C and P is

3. If the ratios of the marginal utility per dollar for the two goods are not equal, consumers will adjust their choices until the marginal utilities per dollar spent for each and every good or service in that bundle are equal.
What’s the logic behind this condition? If you get extra $1 money, what factor should affect
your decision of spending it on C or P?
Sergio has $12 to spend, the price of peanuts is $2 and the price of Coke is $1. The following table
contains Sergio’s utility for each extra unit of peanut and Coke. Sergio try to use every dollar to
maximum utility. He spends first $1 on Coke since it brings him the highest margianl utility, 8. Fill
numbers on the table.
Another example: Your current MUc/Pc=1, and MUp/Pp=2. If you spend $1 less on C, your
utility will decrease by 1 and you will get extra $1 money. You spend this $1 on P, your
utility will increase by 2. By doing so, your total utility increases by 1. Since you can
increase your total utility by simply rearrange your spending, this isn’t an optimal
consumption bundle. Given this case, should we move all of our spending on C to P to
maximum our utility? Why?
IV. From Utility to the Demand Curve
A. Marginal utility, the substitution effect, and the law of demand
1. If the price of a good rises (falls), the marginal utility per dollar of that good falls (rises)
and gives the consumer an incentive to consume fewer (more) units.
2. Point 1 confirms the law of demand: The individual’s demand curve, which relates an
individual’s consumption of a good to the price of that good, is normally downward sloping.
That’s the reason we always assume the downward sloping demand curve.
3. The substitution effect of a change in the price of a good is the change in the quantity consumed of that good as the consumer substitutes the good that has become relatively cheaper for the good that has become relatively more expensive.
Give yourself an example:
4. When a good absorbs a small share of the consumer’s budget, the substitution effect is essentially the entire reason that the demand curve slopes downward.
B. The income effect
1. The income effect of a change in the price of a good is the change in quantity consumed that results from a change in the consumer’s purchasing power due to the change in the price of the good.
2. For the great majority of goods and services, the income effect is not important and has no
significant effect on individual consumption because the good absorbs a small share of a consumer’s budget.
3. When the income effect matters at all (when a good absorbs a large share of a consumer’s budget), the income effect usually reinfources the substitution effect. When the price of a good that constitutes a large share of income rises, consumers of that good are poorer because their purchasing power falls. This effective reduction in income causes the consumer to demand even less of that good.
4. However, this example is only based on normal goods, ie. Decrease in income decrease of demand.
5. In the case of an inferior good, the income and substitution effects work in opposite directions. An increase in price that reduces purchasing power will increase the quantity demanded.
6. A Giffen good is a hypothetical inferior good for which the income effect outweighs the substitution effect and the demand curve slopes upward