Development and human welfare
Definitions of development and human welfare vary, as do attempts to measure it
Development means improvement in the standard of living and quality of life for people within a country.
It includes social progress, economic growth, political stability, environmental protection, and access to opportunities.
Human welfare focuses on how well people’s basic needs are met—such as housing, food, healthcare, education, and freedom.
While development can be measured economically, human welfare includes emotional and social well-being.
Different ways of defining development
Economic definitions
Based on wealth and industrialisation.
Common indicators: GDP (Gross Domestic Product) and GNI (Gross National Income) per capita.
Useful for comparing countries, but they ignore inequalities and informal economies.
Social definitions
Consider the quality of people’s lives: literacy rates, healthcare, equality, and access to services.
Example: a country may have high income levels but poor healthcare or education (e.g., some oil-rich states).
Political definitions
Focus on human rights, political freedom, and corruption levels.
Democracies often allow more citizen participation and accountability, helping sustainable growth.
Environmental and cultural dimensions
Sustainable resource use and protection of ecosystems are essential for long-term development.
Respect for cultural traditions and identity can support community cohesion and welfare.
Factors contributing to development and human welfare
Economic
Strong trade links, diverse industries, stable currency, and job opportunities encourage growth.
Infrastructure such as roads, energy, and ports enables productivity.
Foreign Direct Investment (FDI) brings capital and technology but may lead to exploitation.
Social
Good education increases employment opportunities and innovation.
Access to healthcare improves productivity and lowers mortality.
Gender equality ensures more people contribute to the economy.
Technological
Internet access supports education, banking, and e-commerce.
Transport systems improve mobility and connect remote areas to markets.
Cultural
Attitudes towards women’s rights, religion, or education can affect participation in society.
Open-minded, inclusive cultures tend to develop more rapidly.
Food and water security
Reliable access reduces disease and malnutrition.
Shortages can cause political instability, poverty, and migration.
Political stability and good governance
Corruption, war, or poor management slow development.
Countries with stable governments attract more investment and tourism.
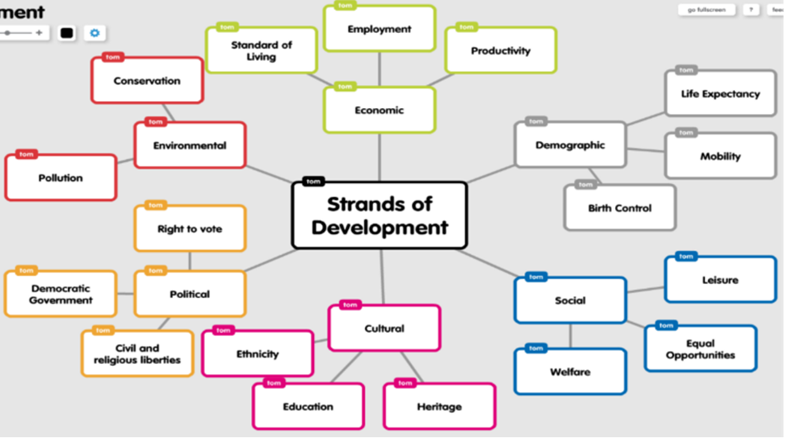
Strands of development:
Social Development
Definition: The improvement made by a country in the quality of life of its people.
How this could be achieved:
Improving literacy levels through access to education
Expanding healthcare services
Increasing life expectancy
Economic Development
Definition: The improvement in a country’s wealth and economic activities.
How this could be achieved:
Increasing the value of goods and services produced
Expanding job opportunities in primary, secondary, tertiary, and quaternary sectors
Environmental Development
Definition: Recognising the importance of protecting and improving the natural world.
How this could be achieved:
Monitoring and reducing greenhouse gas emissions (improving air quality)
Taking action to improve water quality
Sustainable Development
Definition: Meeting the needs of the present without compromising the ability of future generations to meet their own needs.
How this could be achieved:
Using renewable energy sources instead of depleting fossil fuels like oil and gas
Protecting natural environments and resources
Development and the UN
The United Nations Development Programme (UNDP) works to eradicate poverty and supports countries in achieving the UN Sustainable Development Goals (SDG).
Development gives people more freedom to make choices
Support countries and people in the long term
Balancing all aspects of development
Measuring development
GDP per capita
Total economic output divided by the population.
Advantages: simple, widely available, easy comparison.
Disadvantages: hides inequality, ignores quality of life and environmental damage.
GNI per capita
Includes money earned abroad (remittances, overseas business).
Reflects true wealth but still ignores inequality.
Human Development Index (HDI)
It is a composite index developed by the United nations development programme (UNDP) to measure and compare levels of human development across countries
It combines 3 key dimensions:
Health, measure by life expectancy at birth
Education, measured by mean years of schooling and expected years of schooling
Standard of living, measured by gross national income (GNI)
Developed by the UN to compare social and economic progress.
HDI values range from 0-1
Closer to 1 means higher human development
Closer to 0 means lower human development
Countries are grouped into 4 categories
Very high human development
High human development
Medium human development
Low human development
Why it matters:
Easier to identify where a country sits as there are 4 categories
Also more accurate as it takes in account more than one factor
Limitations:
Doesn’t measure inequality - 2 countries with the same HDI could have very different income distributions
(UNDP now publishes the IHDI which is the inequality adjusted HDI to address this)
Ignores environmental sustainability and political freedoms
Data quality can vary, especially in developing countries
Doesn’t reflect short term changes
Measures of inequality
Gini coefficient: shows income inequality (0 = equal, 1 = very unequal).
One of the lead issues with economic indicators is that they usually look at an average, and don’t factor in wealth distribution. To mitigate this, we can use the Gini coefficient to show the extent of income inequality in a country
0 = completely equal
1 = completely unequal
South Africa has one of the highest Gini scores (~0.63), reflecting extreme wealth gaps.
Indices of political corruption
Measured by Transparency International’s Corruption Perceptions Index (CPI).
Low corruption countries like Denmark rank high, whereas Somalia ranks low due to instability.
The CPI is an annual index that ranks countries based on perceived levels of public sector corruption
Why it matters:
Corruption affects economic growth, investment and public trust
It undermines education healthcare and infrastructure by diverting resources
Countries with high corruption often struggle to attract foreign aid and investment
Limitations:
Subjectivity: based on perceptions high can be influenced by media politics or recent scandals
Focus on public sector: doesn’t measure private sector corruption or informal practises
Compatibility issues: cultural difference in defining corruption can affect rankings
No detail: doesn’t show where corruption occurs (e.g. police, judiciary, procurement)
Poverty level:
What people lack primarily through absolute poverty, a fixed minimum standard of basic needs, and relative poverty, which measures deprivation compared to a society's average
They are closely linked to a country's overall economic stability, social progress, public health, and environmental vulnerability
Often rely too narrowly on income, fail to capture non-monetary deprivations like health or education access, are affected by data collection issues, and struggle with the complex, subjective nature of poverty itself
Marginalisation:
Marginalisation refers to the process by which individuals, communities, or regions are excluded from meaningful participation in economic activity, often due to structural, spatial, social, or political barriers.
Key Characteristics of Economic Marginalisation:
Limited access to employment opportunities or formal labour markets.
Exclusion from infrastructure such as transport, digital connectivity, or financial services.
Underinvestment in education, healthcare, and skills development.
Geographical isolation, such as remote rural areas or informal urban settlements.
Discrimination based on ethnicity, gender, disability, or migration status.
The level of development and human welfare varies globally and has had a range of consequences
Key terms:
Fertility rate
The average number of births a woman will have in her lifetime
Death rate
The number of deaths/1000 per year
Natural increase
Difference between birth rate and death rate
Infant mortality rate
The number of babies who die before their first birthday/1000 per year
Global pattern of uneven development
The world is divided into HICs (High-Income Countries), NEEs (Newly Emerging Economies), and LICs (Low-Income Countries).
Most HICs are found in the Northern Hemisphere (North America, Europe, Japan), while many LICs are in Africa and South Asia.
A lot of low income countries in Africa
A lot of high income countries in North America
The whole of Europe can be seen to be high income countries
Australia is the main high income country in the southern hemisphere
Uneven development is visible between and within countries (e.g., rich urban centres vs poor rural areas).
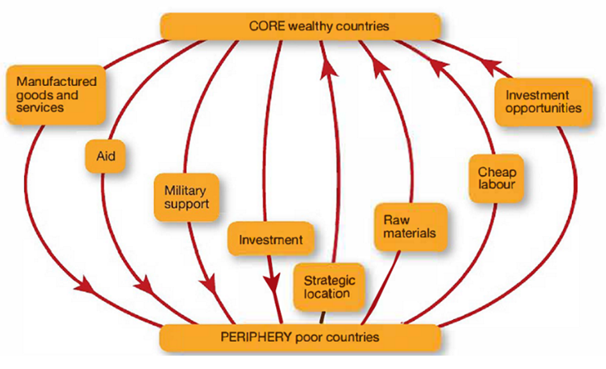
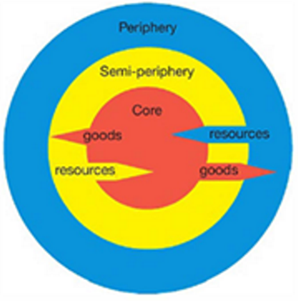
Core/periphery model:
Core regions often have big advantages such as:
Fertile soil
Close to important markets (trade)
Good communication links
Easy access to energy supplies
Healthy climate, warm climate
River/sea ports; important trade routes
Periphery regions sometimes have disadvantages:
Poor soil, difficult relief (mountains)
They are a long way from the core and its advantages
Communications may be difficult (especially by road)
Lack of energy resources
Diseases may be common (malaria)
Climate hazards (droughts, floods)
Factors affecting uneven development:
Social investments:
Investment in a country is key to increasing its trade
Some developing countries have increased their trade over recent year such as china, India, Brazil and Mexico
Emergence of NICs has been a major success of globalisation. Although 2bn people live in countries who trade has fallen in relation to GNI
Sometimes when developing countries increase their volume of exports, revenues actually decline due to saturate markets
Prioritising education and healthcare investments has generally led to faster development
Can be hindered by pandemic
Key to dropping fertility is female literacy rate
Improved knowledge of birth control
Greater social awareness
Employment opportunities
Trade and investment:
Uneven development
Poorer nations export cheap raw goods, import expensive manufactured goods.
Creates trade deficits and dependence.
FDI (foreign direct investment) flows mostly to stable, wealthier countries.
Example:
Ghana exports cocoa cheaply, Europe profits from chocolate.
China → huge FDI inflows; Chad → little investment.
Future solutions:
Develop local industries to add value (e.g. process cocoa locally).
Diversify exports beyond primary goods.
Special economic zones to attract investors.
Negotiate fairer trade agreements.
Technology
Uneven development
Advanced tech = rapid industrialisation, modern farming, better healthcare + education.
Lack of tech = outdated farming, weak communication, limited industry.
Creates a digital divide where poorer countries miss out on global markets.
Example:
South Korea → almost universal high-speed internet, strong global firms (Samsung).
Sub-Saharan Africa → millions without electricity/internet → reduced opportunities.
Future solutions:
Technology transfer between nations.
Aid/subsidies for ICT + energy infrastructure.
Train local people to maintain tech.
Encourage home-grown innovations (e.g. African solar startups).
Colonialism
Uneven development
Colonies exploited for raw materials.
Infrastructure built for exports, not local growth.
Artificial borders → ethnic divisions → instability.
Former colonies inherited weak economies + industries.
Example:
India under British rule → textiles restricted, railways mainly for exports.
Nigeria exploited for palm oil → fragile economy after independence.
Future solutions:
Rebuild infrastructure for local benefit.
Diversify economies beyond raw materials.
Debt relief, reparations, and fair trade systems.
Neocolonialism
Uneven development
Poor countries remain dependent on rich ones.
Control through debt, trade agreements, or foreign corporations.
Profits leave poorer countries instead of being reinvested.
Example:
IMF/World Bank loans → strict conditions (e.g. cutting social spending).
Zambia → foreign copper companies profit, little left for locals.
Future solutions:
Diversify economies + reduce reliance on single exports.
Regional cooperation (e.g. African Union).
Negotiate fairer contracts with multinationals.
Debt relief + international regulation of corporations.
Political and Economic factors
Poor access to global trade markets restricts exports and economic growth.
Dependence on single commodities makes economies vulnerable to price changes (e.g., oil in Nigeria, copper in Zambia).
Some countries have limited access to sea routes or resources (landlocked countries like Chad).
Uneven development
Poor governance = corruption, weak institutions, instability.
Bad policies (e.g. excessive borrowing, protectionism) → economic collapse.
Good governance = investment, fair distribution of resources, stable planning.
Example:
Zimbabwe under Mugabe → hyperinflation + economic collapse.
Singapore → anti-corruption + long-term planning → rapid growth.
Future solutions:
Strengthen institutions + democracy.
Enforce anti-corruption laws.
International support + training in governance.
Media + civil society holding leaders accountable.
Social factors
Rapid population growth increases pressure on housing, jobs, and food.
Poor healthcare systems cause low life expectancy and productivity.
Education inequality limits social mobility and skills development.
Environmental factors
Frequent droughts, floods, or natural disasters damage agriculture and infrastructure.
Climate change impacts developing nations most severely, deepening poverty cycles.
Open vs closed economies:
Open economies (e.g. UK and Singapore), which encourage FDI, have developed faster
Multiplier effect
Closed economies (e.g. North Korea) engage with limited trading and their development suffers as a result
Some closed countries do then open up more (e.g. India in the 1990s)
Impact of uneven development on welfare and quality of life Case Study - India:
India has areas of rapid economic growth (Mumbai, Bangalore) and extreme poverty (Bihar, Uttar Pradesh).
Poverty: over 200 million people live below the national poverty line.
Unemployment: many rely on informal or seasonal jobs without security.
Inadequate housing: slums like Dharavi house over 1 million people in unsafe conditions.
Infrastructure gaps: rural areas lack electricity, clean water, and healthcare facilities.
Education inequality: literacy is around 90% in urban areas but only 65% in rural states.
Uneven development has created regional migration as people move to cities for better opportunities.
Case studies on uneven birth rates:
South Korea: Extremely Low Birth Rate (0.72 in 2023)
Circumstances
Economic development: Highly developed, urbanised, and technologically advanced economy.
Fertility rate: The lowest in the world, far below replacement level (2.1).
Aging population: Rapidly aging society with a shrinking labor force.
Gender equality gap: The largest gender pay gap among OECD countries; women face workplace discrimination and unequal childcare expectations.
Social change: Declining marriage rates, very few births outside marriage, and a rising feminist movement rejecting traditional family roles (the “4B movement”).
Education and housing costs: Extremely high cost of education and housing, especially in Seoul, discouraging childbearing.
Work culture: Long working hours, limited flexibility, and pressure discourage both men and women from taking parental leave.
Government Response and Challenges
Pronatalist policies: Government offers cash incentives, parental leave, and housing support to encourage births.
Limited impact: Financial incentives have shown minimal long-term effect on increasing fertility—many births would have happened anyway.
Structural issues: Deep-rooted cultural and economic barriers—work stress, high cost of living, gender inequality—are harder to fix than financial aid.
Demographic pressure: Aging population threatens pension systems, healthcare funding, and economic dynamism.
Policy recommendation: Experts call for gender equality, affordable childcare, workplace reform, and immigration openness to sustain the population.
Niger: Extremely High Birth Rate (6.6 in 2022)
Circumstances
Economic situation: One of the poorest countries in the world, with a per capita income of about $600/year.
Fertility rate: The highest in the world — 6.6 children per woman.
Population growth: Set to triple by 2050 (from 24 million to 68 million).
Social norms: Large families and polygamy are culturally valued and tied to religion and social prestige.
Religion and tradition: 98% of the population is Muslim; early marriage is common (77% of girls married before 18).
Education and healthcare: Limited access to education—especially for girls—and poor healthcare contribute to high fertility and maternal mortality.
Poverty cycle: Families have more children to compensate for high child mortality and to gain labor or dowries, which in turn perpetuates poverty.
Security issues: Insurgencies and instability make schooling (especially for girls) difficult.
Government Response and Challenges
Reform efforts: President Bazoum promotes girls’ education, delays in marriage, and even criticised polygamy—a politically sensitive move.
Religious and cultural resistance: Some men view population control as an imposition of Western values; religious beliefs stress that “God will provide.”
Early progress: Slight declines in teenage pregnancies and more acceptance of contraception among religious leaders and men.
Developmental risks: High fertility threatens food security, education, employment, and stability; too many young people and too few jobs increase risk of poverty and extremism.
Policy recommendation: Focus on education (especially for girls), women’s empowerment, access to contraception, and changing cultural norms.
Differences in demographic data between countries
Indicator | Developed country (UK) | Emerging country (Brazil) | Developing country (Nigeria) |
Fertility rate | 1.6 | 1.9 | 5.1 |
Death rate | 9/1000 | 6/1000 | 12/1000 |
Natural increase | Low or negative | Moderate | High |
Population structure | Ageing | Balanced | Youthful |
Maternal mortality | 7/100,000 | 60/100,000 | 800/100,000 |
Infant mortality | 3.5/1000 | 14/1000 | 70/1000 |
Life expectancy | 81 years | 76 years | 55 years |
Developed countries have low fertility and ageing populations, creating strain on pensions and healthcare.
Developing countries have youthful populations, which can create opportunities (large workforce) but also pressure on education and jobs.
A range of sustainable strategies is required to address uneven levels of development and human welfare
International strategies to reduce uneven development
Aid
Short-term aid: provides immediate help after disasters, e.g., UK emergency aid to Nepal (2015 earthquake).
Long-term aid: aims to improve infrastructure, education, and healthcare, e.g., UK aid to Africa for malaria prevention.
Reduces suffering and improves productivity, but aid can create dependency or be misused by corrupt officials.
Fair Trade
Ensures producers in developing countries receive fair prices and safe working conditions.
Supports local community projects such as schools or clean water.
Example: cocoa farmers in Ghana benefit from higher income and training through the Fairtrade Foundation.
Debt relief
Cancelling or restructuring loans allows governments to invest in welfare and development.
Example: 2005 G8 agreement cancelled $40 billion of debt owed by 18 poor countries.
Intergovernmental agreements
The Paris Climate Agreement (2015) encourages sustainable, low-carbon growth.
The UN’s Sustainable Development Goals (SDGs) set 17 global targets for 2030 (e.g., ending poverty, gender equality, clean energy).
Different types of aid:
Most aid comes from governments in the form of grants or cheap loans
Most developing countries keen to accept foreign aid because:
Many lack the hard currency to pay for vital imports
Many have sufficient savings to invest into industry and infrastructure
Many lack important technological skills
Multilateral:
When a government donates aid to an international organisation who then distributes it around the world
Bilateral:
When a government gives aid directly to another government
Voluntary
When Non-governmental organisations (NGOs) distribute aid around the world
Top-down
Where decisions are made by politicians or organisations
Bottom-up:
Where decisions are made by the groups of people who are to receive the aid
Who gives aid:
Unites nations agencies (multi-lateral)
World bank
UNICEF (Children)
UNHCR (refugees)
UNDP(development)
National governments (Bi-lateral)
UK foreign
Commonwealth and development office (FCDO)
NGOs
Oxfam
Save the children
Issues with aid:
Corruption – poor decision making, stealing of money
Tied aid – where conditions are attached to aid, usually bilateral
Inappropriate – often involving technology of too high a level for the people involved
Slow to respond – emergencies often require people on the ground, not always the case with big multilateral organizations
Dependency – free food after an emergency can put farmers out of business, making long term issues worse
Dependency theory:
How does the relationship between core and periphery work?
The core are able to give goods out to the periphery and the periphery in turns provides resources that the core has to source from outside of their country, the core often gets to decide cheaper prices for the resources and also can put countries and factories in competition with each other.Who benefits the most?
The core as they are benefiting the most from all of resources of the periphery and are also in control of trade and prices between them and wellDoes aid help to reduce this dependency?
Yes as aid is able to provide goods that the periphery needs from the core to reduce demand and break the cycle. Aid can also make it worse if a country from the core provides resources to the periphery such as loans etc and then request precious resources in the future at a cheaper price
Appropriate aid:
Aid matched to the technology needs and skills of the people who are being helped
It is best if the community is involved (bottom-up) in saying what they want and in developing the solutions themselves
Technology:
Many examples of bilateral aid in the 1970s-1990s involved inappropriate technology
Examples include:
Hydroelectric Power Station in Mozambique
Danish tractors to India
Immediate technology:
This is technology that is half way between that of the donor country and the recipient country
It is a lower level of technology that is more accessible and useful to the people of a developing country
It should not require either a high level training or the presence of foreign experts
Case study of immediate technology (Practical action):
What Practical Action does:
Practical Action is an international charity that helps people living in poverty use simple, sustainable technologies to improve their lives. They focus on clean energy, farming, water and sanitation, and helping communities adapt to climate change. Their goal is to use intermediate technology—tools and systems that are affordable, easy to use, and can be maintained by local people.
Example 1: Turning Water into Work (Zimbabwe)
Practical Action helped farmers in dry areas of Zimbabwe by installing solar-powered irrigation systems and building sand dams to store water. They trained local people to manage and repair the systems and taught eco-friendly farming methods. This allowed families to grow more food and earn money all year round.
Example 2: Waste and Sanitation in Bangladesh
In Bangladeshi cities, Practical Action improved waste and sanitation systems by introducing simple machines like the “gulper,” which lets workers clean pits safely from outside. They also helped turn waste into compost and recycling businesses. This created jobs, improved health, and reduced pollution
The development gap:
The development gap refers to the significant disparity in economic, social, and infrastructural development between countries or regions.
This gap results from historical, geographic, political, and economic factors.
Colonialism often left former colonies with weak institutions and economies.
Geographic factors, such as access to resources or natural barriers as well as climate influence a region's development potential.
Political instability and poor governance hinder sustainable growth, while global economic systems can exacerbate inequality by favoring wealthier nations.
The gap is further widened by differences in education, healthcare, technology access, and investment, leading to unequal opportunities and living standards across the globe.
Different views on tackling the development gap
Individuals
Support ethical shopping (Fairtrade), reduce waste, donate to charities.
Example: consumers buying Fairtrade coffee or clothing from sustainable brands.
NGOs
Focus on long-term community-based development.
Example: WaterAid builds wells and toilets, reducing waterborne diseases.
Example: Oxfam funds education and women’s empowerment programmes.
Governments
Developed governments (like the UK) invest in overseas aid and partnerships to promote stability and trade.
Emerging countries (like China) provide infrastructure loans and trade deals through initiatives such as the Belt and Road Initiative.
Some critics argue Chinese investment helps infrastructure but can create debt dependency.
Intergovernmental organisations
The World Bank funds infrastructure projects to encourage economic growth.
The IMF provides loans to stabilise economies but often requires austerity measures that can reduce welfare spending.
Debt relief:
Debt relief frees up funds for social spending as it eliminates unserviceable interest
Issues with debt relief:
Corruption
Military dictatorships
Poor decision-making
Unrealistic ideas of profit
Inappropriate technologies
Interest rates
All lead to increasing debt
Eventually many countries began to ‘default’
Expanded issues on debt relief:
Issue | Cause / Description | Consequence / Impact |
Unequal creditor participation | Some private and non-Paris Club creditors don’t join debt relief programs. | Countries remain in debt to non-participating lenders. |
Re-accumulation of debt | New borrowing after relief; poor financial management or economic shocks. | Risk of falling back into debt |
Slow, complex process | Long requirements before reaching “completion point.” | Delays full debt cancellation. |
Limited eligibility | Only poorest HIPC countries qualify. | Other indebted countries left out. |
Donor dependence | Relief relies on international funding. | If donors delay, debt relief stalls. |
Misuse of savings | Weak governance or corruption. | Freed funds don’t benefit the poor. |
Moral hazard | Expectation of future debt relief. | Encourages irresponsible borrowing. |
Lack of sustainability | Weak economies, low exports. | Debt problems reappear over time. |
Purpose
Launched 1996 by IMF & World Bank to help poor countries manage unsustainable debt.
Supplemented by Multilateral Debt Relief Initiative (2005) → 100% debt relief from IMF, World Bank & African Development Fund.
2007: Inter-American Development Bank added extra (“beyond HIPC”) relief for 5 Western Hemisphere countries.
Countries need to qualify
Be eligible for IDA (World Bank) & PRGT (IMF) loans.
Have unsustainable debt not fixable by normal means.
Show track record of reforms under IMF/World Bank programs.
Create a Poverty Reduction Strategy Paper (PRSP) through public participation.
Process
Decision Point - IMF & World Bank approve eligibility; interim debt relief begins.
Completion Point - Full debt relief granted when country:
Maintains good performance.
Implements agreed reforms.
Applies PRSP for ≥1 year.
39 eligible countries, 36 completed and now receive full relief.
Impact
Freed funds for health, education & social services.
Before HIPC: more spent on debt than on social services.
After HIPC: spending on social sectors is 5× higher than on debt.
Debt service fell -1.5% of GDP (2001–2015); still below pre-HIPC levels.
Funding
IMF share from:
Bilateral contributions.
Investment income from 1999 gold sales - PRGT-HIPC Trust.
Somalia & Sudan reached decision point but need extra funding (plans approved 2019 & 2021).
Eritrea eligible but owes nothing to IMF.
Current Challenges
Some creditors not fully participating (participation is voluntary).
IMF & World Bank continue to urge all creditors to deliver full relief.
Fair trade:
Fair trade is all about getting fair prices for goods produced in poorer countries e.g. coffee
Companies who want to sell produce labeled as fair trade haste to pay producers a fair price
Buyers also pay extra on top of fair price to help develop the area where the goods come from e.g. to build schools or health centres
Only producers that treat their employees well can take part in the scheme
E.g. pruners aren’t allows to discriminate based on sex or race and the employees must have a safe working environment. This improves quality of life for the employees
Microcredit:
Microcredit is a common form of microfinance that involves an extremely small loan given to an individual to help them become self-employed or grow a small business.
Biggest beneficiaries tend to be women
Issues:
High interest rates
Recipients often misuse loans for consumption rather than to set up a new business
Why trade isn’t fair:
LICs | HICs |
Mainly produce low value primary goods | Mainly produce high value secondary good |
Often have to pay large tariffs to get there goods in HICs | Can protect their own production by charging imports tariffs on foreign goods |
Struggle to produce goods of a sufficient quality to pass legal requirements | Can impose legal requirements on goods to protect consumers |
Prices are driven lower by a surplus of producers - race to the bottom | Can import raw materials at rock bottom prices by shopping around |
Cannot get their voices heard at world trade negotiations | Can dominate world trade negotiations |
Production is often dominated by foreign Trans-National corporations | Can exploit LICs by buying up local industries and retaining profits |
Are not allowed to give farmer subsidies | Often heavily subsidies their farmers to keep them in business |
Reasons for variations in development between countries:
Physical Geography | Landlocked – No water surrounding it, lack of water resources leading to bad hygiene, countries that are landlocked are also very easy for countries to attack and invade. Climate – If the climate is very dry and arid or humid, droughts will happen more often and precipitation will be scarce Natural resources – If a country has a lot of natural resources, this may cause a problem as lots of countries will fight for it leading to the country becoming poorer and hindering development due to war and disputes. |
Economic Policy | Open economies – The country will be able to trade Closed economies – |
Demographics | Whether there is a largely aging population within the country, the amount of babies being born, having the freedom to migrate, being able to receive services, death rates |
Technology | Technological advancements can increase job efficiency by having robots or AI take some of the more replaceable jobs, technology can also improve society as a whole by making information more widespread which can help increase awareness and education for everyone. |