Independent Samples T-test
Definition (#f7aeae)
Important (#edcae9)
Extra (#fffe9d)
T-test:
Introduction to t-test:
Involves comparison of 2 “groups” or “conditions” or “levels” (IV).
Whether differences between the groups/levels are significant or not.
DV must be a continuous variable.
3 types:
One sample t-test.
Independent-sample t-test.
Paired sample t-test.
General assumptions on t-test:
DV must be interval or ratio scale.
Random sampling from the population.
Data is normally distributed.
Variances of groups / conditions are equal.
T-test:
Compares 2 types of variability:
Explained variability: The difference between groups (caused by the IV).
Unexplained variability: Differences within each group (caused by other factors like random error or individual differences).
t: Explained variance (difference in means)/unexplained variance (standard error).
If there's a big difference between group means and small differences within groups, the t-value will be large. Suggesting the groups are truly different.
t-value close to zero means the group means are similar, supporting the null hypothesis (no real difference).
t-value far from zero means the group means are likely different, and the p-value will be small (p < α), suggesting a statistically significant result.
Understanding Degrees of Freedom (df):
df: Number of independent values that can vary in a statistical calculation.
Represents the amount of information available to estimate the parameters.
Related to sample size – more data, more freedom.
Used in many statistical tests (t-tests, ANOVA, chi-square).
Affects the shape of the sampling distribution.
The 'flexibility' in your data before constraints are applied.
Degrees of freedom in t-test:
One-sample t-test: df = n - 1 [ex: n = 20 → df = 19]
Independent samples t-test: df = n₁ + n₂ - 2 [ex: n₁ = 15, n₂ = 15 → df = 28]
Paired samples t-test: df = n - 1 [ex: n = 12 → df = 11]
Independent Samples T-test:
Overview:
Compares the means of two independent groups.
Used to test whether there is a statistically significant difference between the two groups.
Groups must be unrelated (Group A ≠ Group B).
Each participant contributes only one score to the analysis.
When Do We Use Independent Samples t-test:
Used in between-subjects design.
Each group must consist of different participants.
Commonly used in experimental and quasi-experimental research.
Useful when comparing two conditions/groups (control vs. treatment).
Works best when the sample sizes of the two groups are similar.
Sample size:
Each group should have at least 20-30 participants to ensure statistical power and reliability.
Small samples (< 20 per group) can be used but may:
Violate assumptions (especially normality).
Reduce power (harder to detect a real effect).
Be more vulnerable to outliers and sampling bias.
Assumptions:
Independence of observations: No participant is in more than one group.
Normality: Scores in each group should be approximately normally distributed.
Homogeneity of variance: The variances of the two groups should be roughly equal.
Dependent variable should be measured at interval or ratio level.
Analysis:
Analyze → Compare means → Independent sample T-test.
Put DV in “test variable” → Put IV in “grouping variable”.

Click “define groups” → Put in the values you used for each group → “Click continue”.

Click “OK
Interpretation:
Check Levene’s test:
If not significant (variances are equal), use values from the first row. If significant (variances not equal), use values from the second row.
Table: Independent Samples Test.
See “sig”:
If sig (p) <.05, there is a significant difference between groups. If sig (p) >.05, there is no significant difference between groups.
Table: Independent Samples Test.
See the means of each group to see which group scored higher only if there is a significant group difference.
Table: Group Statistics

Homogeneity of variances:
Levene’s test not significant (p > .05): Variances of the 2 samples are not statistically different.
Levene’s test significant (p < .05) : Variances of the 2 samples are statistically different.
The assumption is not met.
Have to use corrected t-test instead.
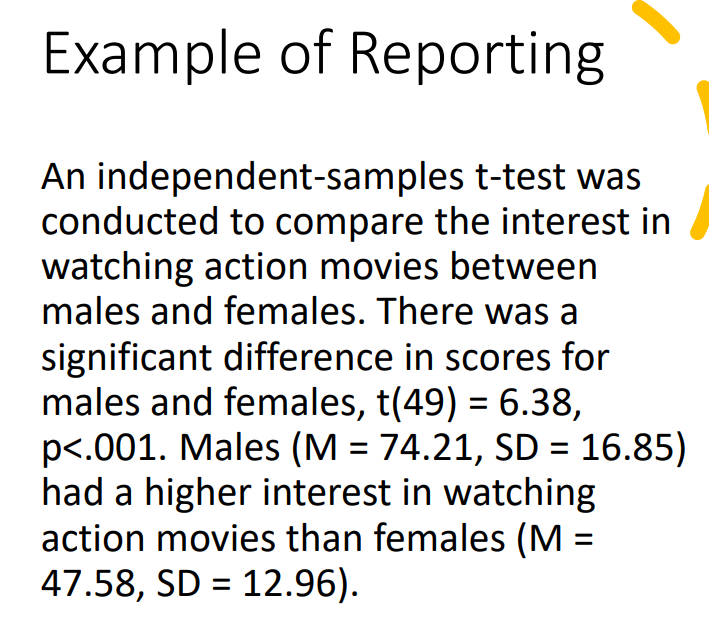
Template:
What test you ran and what variables were plugged in.
Is there a significant difference between group.
Report the “equation” above with the values.
Interpretation:
If significant: Which group scored higher and lower.
If not significant: Groups had similar scores.