Logistic Regression
Binary variables: 0 and 1
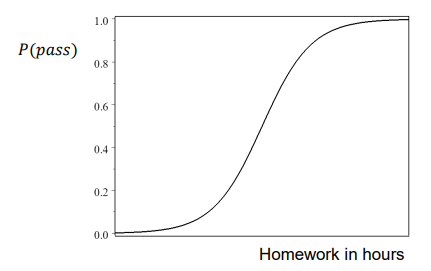
Y indicated whether event occurs (1) or not (0) (e.g. passing an exam)
Probability & Odds
expressed in terms of success (Y occurs) and failure (Y does not occur)
P(success) = 0.75 → P(failure) = 1 - 0.75 = 0.25
Odds(success) = P(success)/ P(failure) = 0.75/ 0.25 = 3
odds of success are 3 to 1 - for every 3 sucesses there is 1 failure - we are 3 times more likely to have a success than a failure
Odds(failure) = P(failure)/ P(success) = 0.25/ 0.75 = 0.333
odds of success and the odds of failure are reciprocal of one another: 1/3 = 0.333 // 1/0.333 = 3
Estimation of probability
^P(Y) = no. of events Y/ total no. of events
Estimation of odds
^odds(Y) = number of events Y/ number of events not Y
Expressing one in terms of the other
^ odds(pass) = ^P(pass) / 1 - ^P(pass)
^P(pass) = ^odds(pass)/ 1 + ^odds(pass)
odds ratio - dividing odds of one group by odds of the other → e.g. the odds of science students liking statistics are … times greater than for a social science student
Regression model
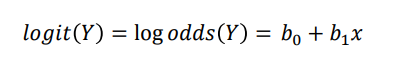
regression model makes prediction on Y but probability ranges [0;1] and odds range [0;∞] → need to create Log Odds of Y, which range [-∞; ∞]
Logit of Y
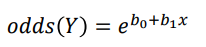
Odds of Y
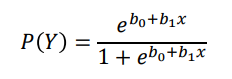
Probability of Y
If X has positive effect → b1 > 0 → probability to pass increases w hours spent
Neg effect - down curse
No effect - straight line
Model for odds of Y
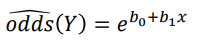
Odds ratio of predictor X = eb1
APA: For each unit increase in X, the odds of Y increase with a factor eb1
Results
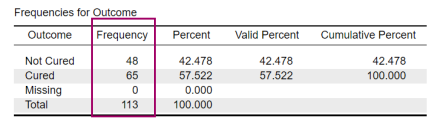
→ get Proportion cured: ^P(cured) = no. cured/ total no
→ Odds cured: ^odds(cured) = no. cured/ no. not cured
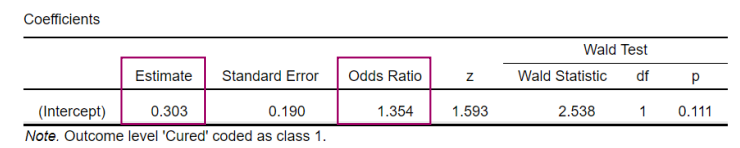
^odds(cured) = eb0 = e0.303 (e to the estimate power) = 1.354 (odds ratio)
Interpretation: The ratio cured/ not cured is 1.354.
For every not-cured person, there are 1.354 cured ppl (for every 3 not cured ppl, there are 4 cured).
Hypotheses:
H0: β0 = 0 - the log-odds of being cured are zero
H0: eβ0 = 1 - the odds of being cured are 1 (equally likely to be either)
Probability compares to 0.5
APA: The odds of being cured with A property are odds ratio times greater than the odds of being cured w/o A
The odds ratio, comparing the A conditions, is/ is not significantly different from 1, p = …
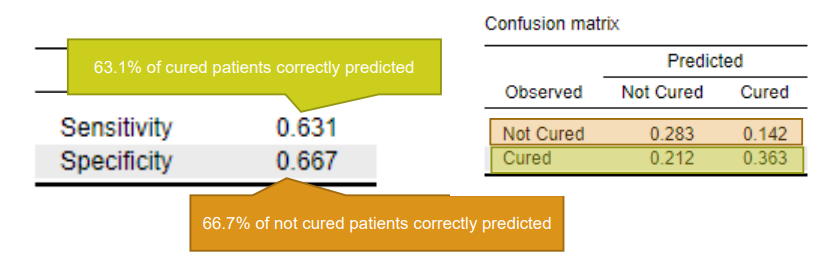
Performance diagnostics
Confusion matrix - correct and incorrect predictions made by model
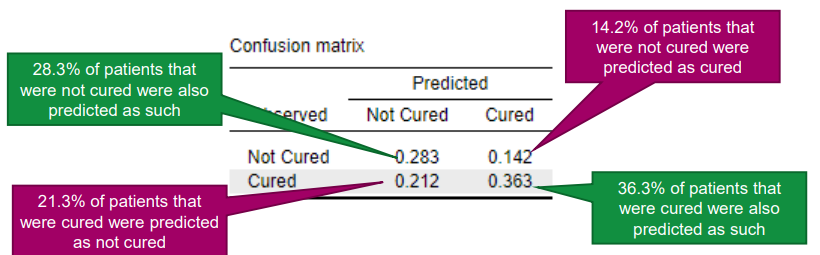
Performance metrics: Sensitivity - how well does model predict positive predictions
Specificity - how well does it predict negative predictions