2.6.3 Supply side policies
AD/AS diagrams
Keynesian curve to demonstrate this
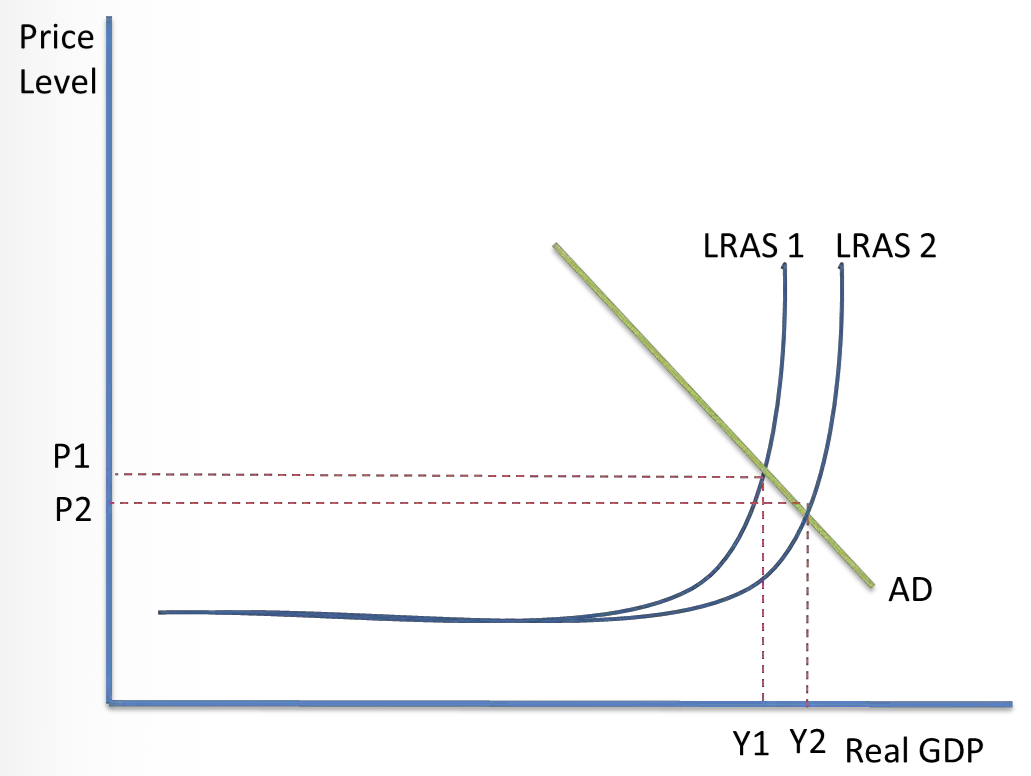
LRAS curve shifts to the right to show the increase in the productive potential of the economy.
Leads to a fall in the average price level from P1 to P2 and an increase in national output from Y1 to Y2.
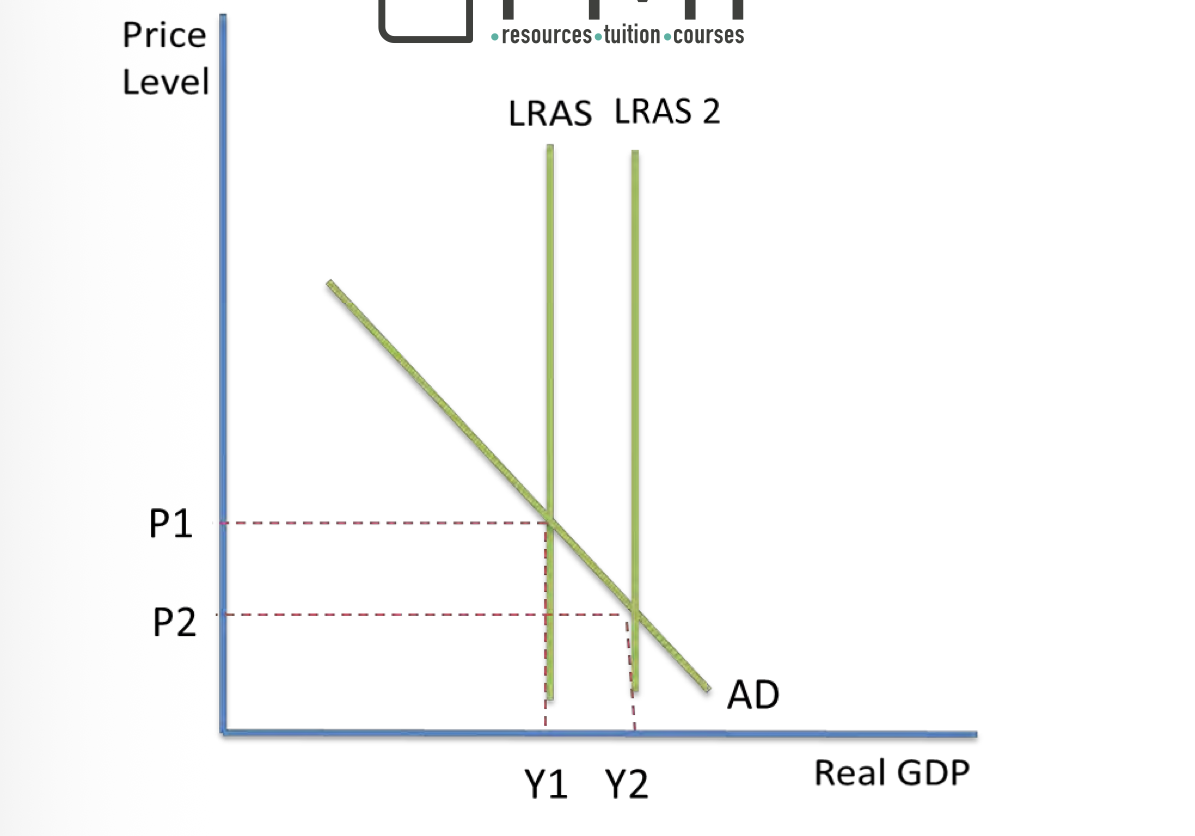
Classical curve to demonstrate this