CH 2 Circular Flow Diagram and Production Possibilities Frontier
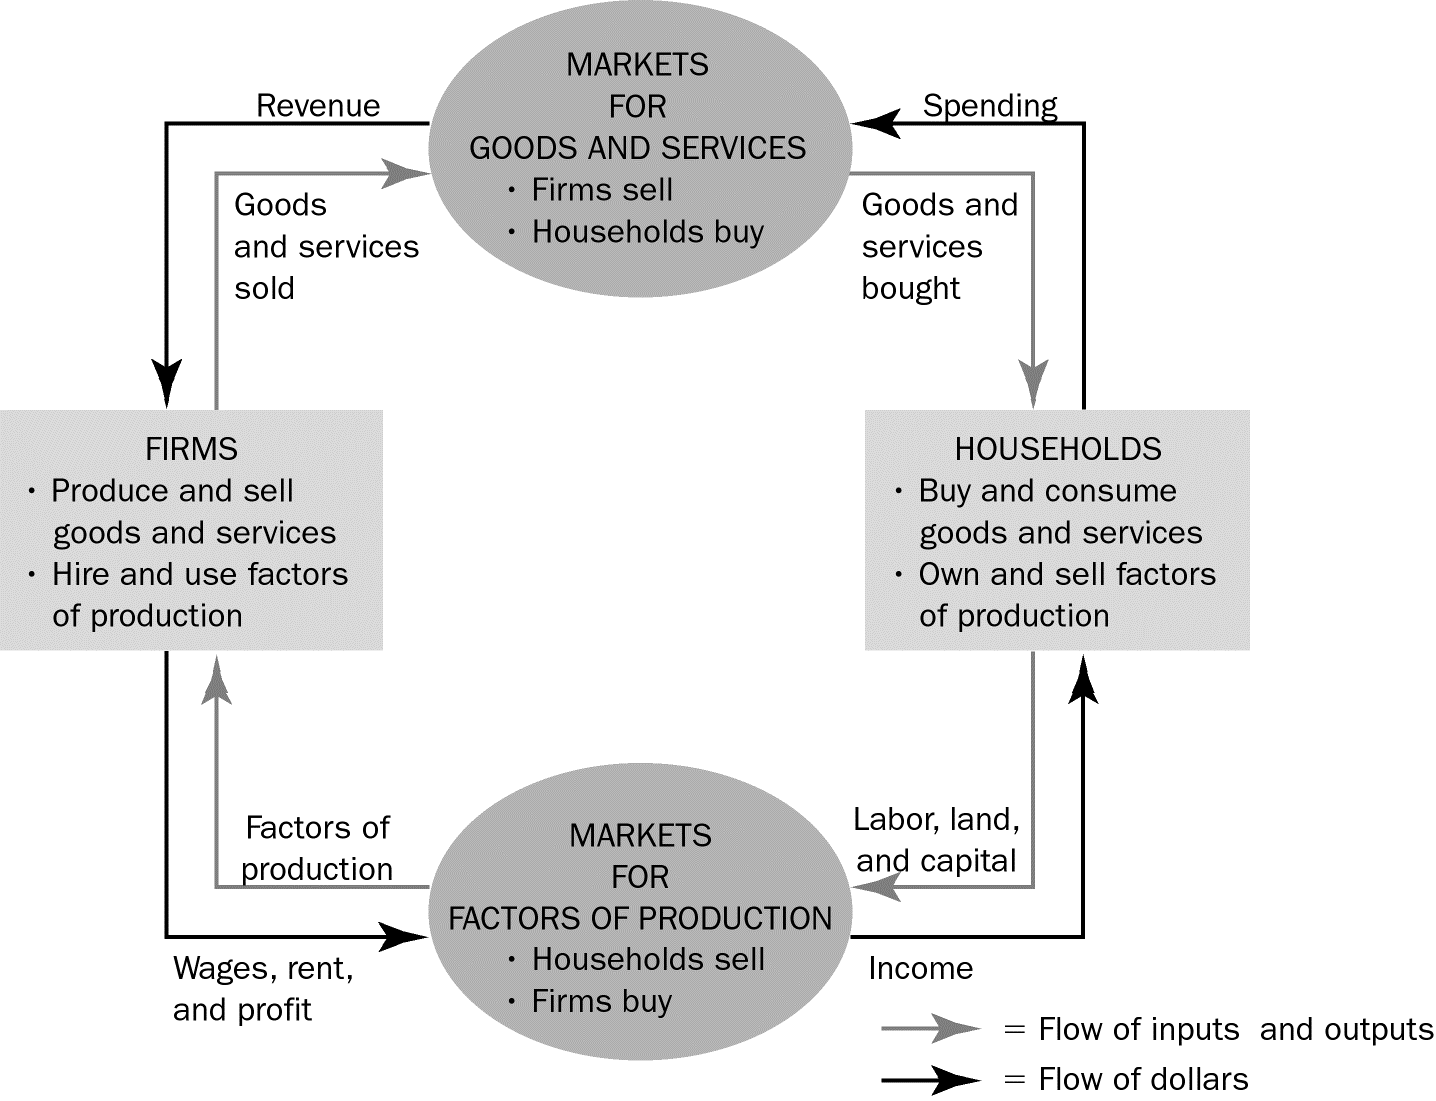
This diagram models the economy, excluding government and international trade. It illustrates two decision-makers: households and firms, operating in the markets for goods and services and factors of production. Firms sell goods and buy factors, while households buy goods and sell factors. The inner loop shows input-output flows between them, and the outer loop represents dollar flows.
Circular Flow Diagram
2 Decision makers
households
firms
2 markets
product market
factors (of production market)
Factors of Production
Inputs used to make outputs
4 factors of production
Capital
Equipment, Machinery, buildings
Labor
Natural Resources
Technological knowledge
Product market
Households buy
Firms Sell
Factors market
Households sell
Frims buy (buy labor)
Production Possibility Frontier (PPF)
PPF is a graph
not a slope its a Bode
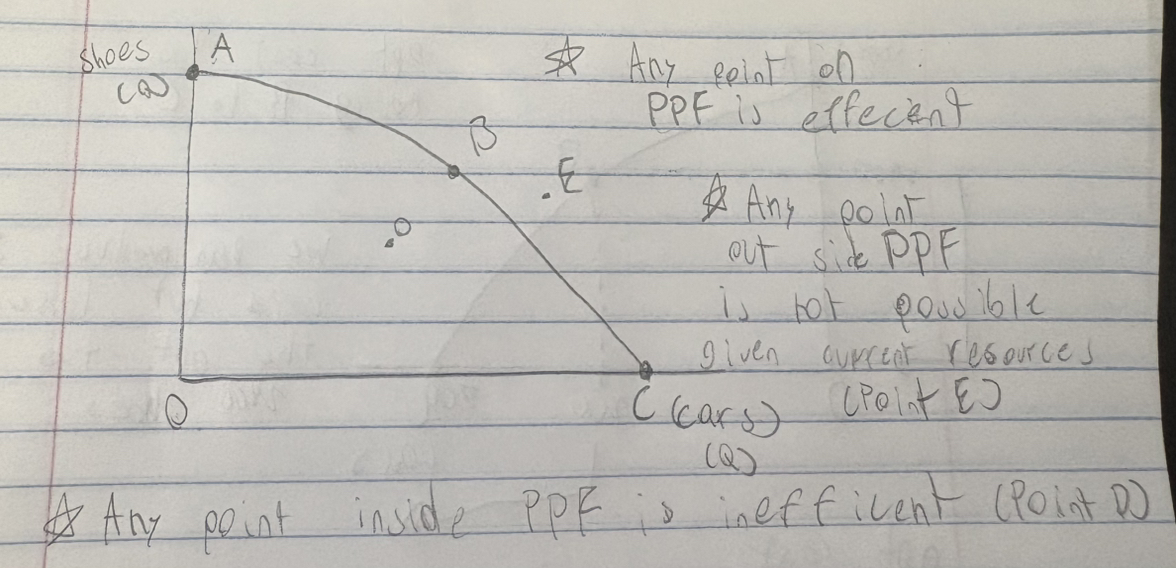
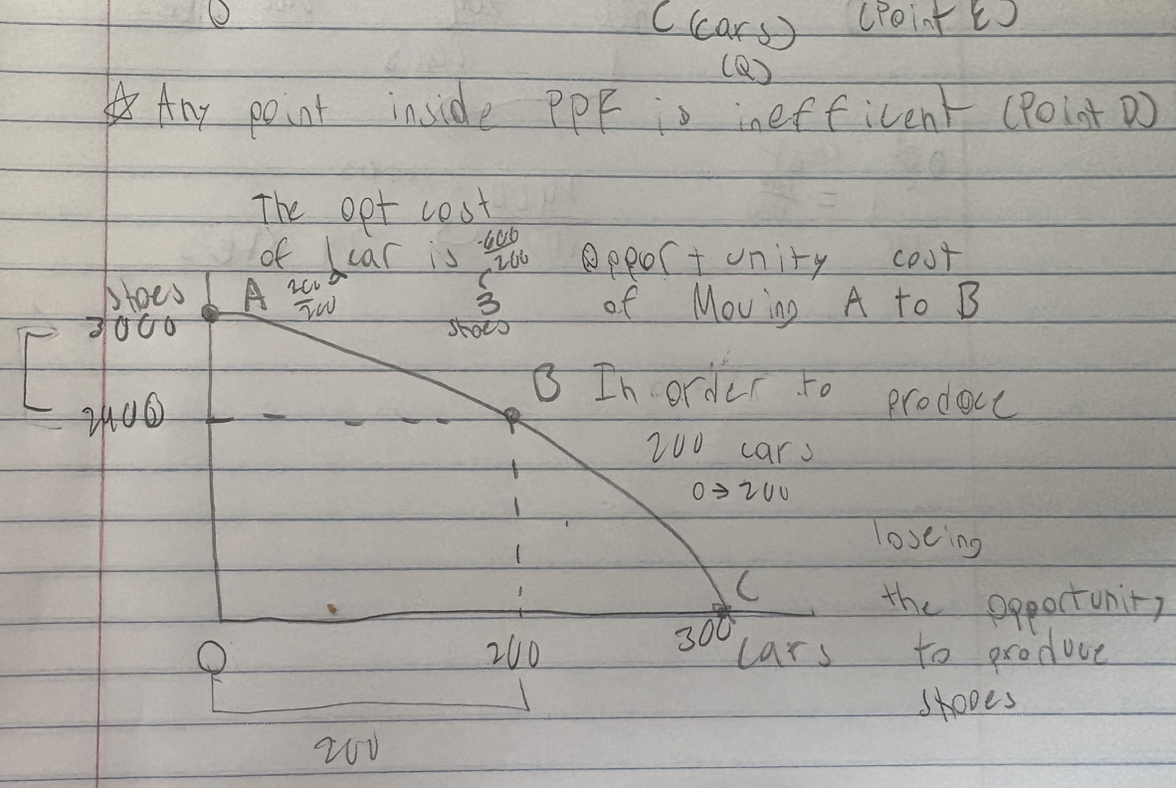
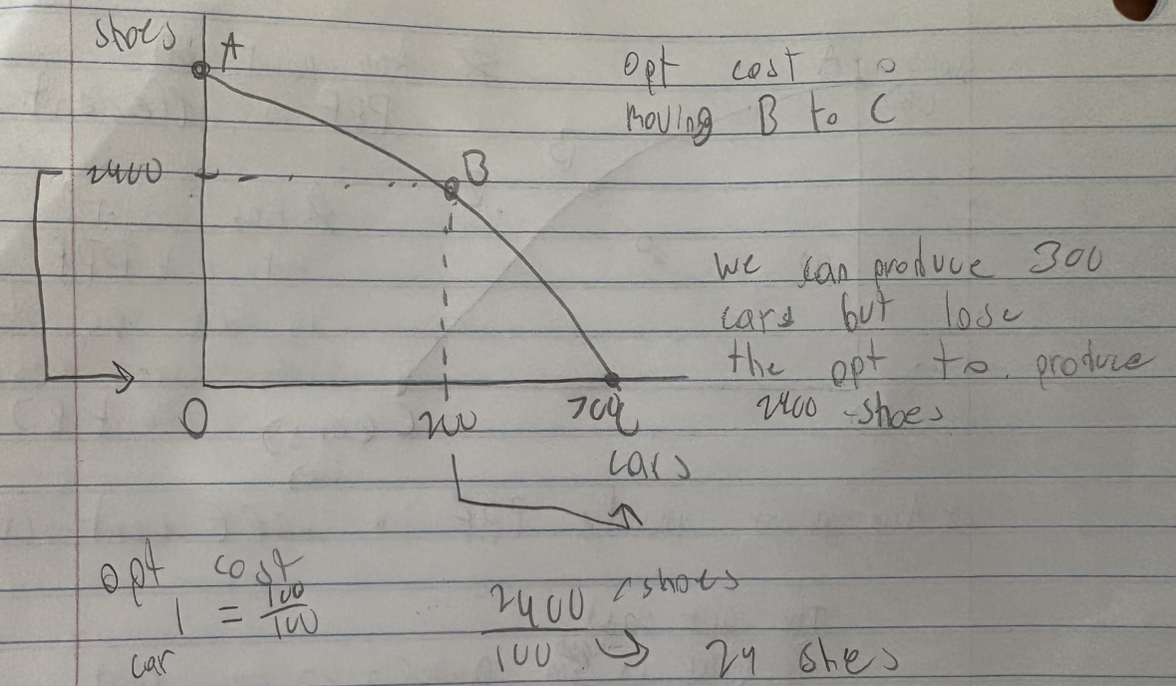
As we produce more and more of one good, that means we have to produce less and less of another good, so the opportunity cost goes up
Opportunity cost increases when switching production; for example, a shoemaker may struggle to make cars if reassigned, resulting in lost proficiency in shoe production as well.
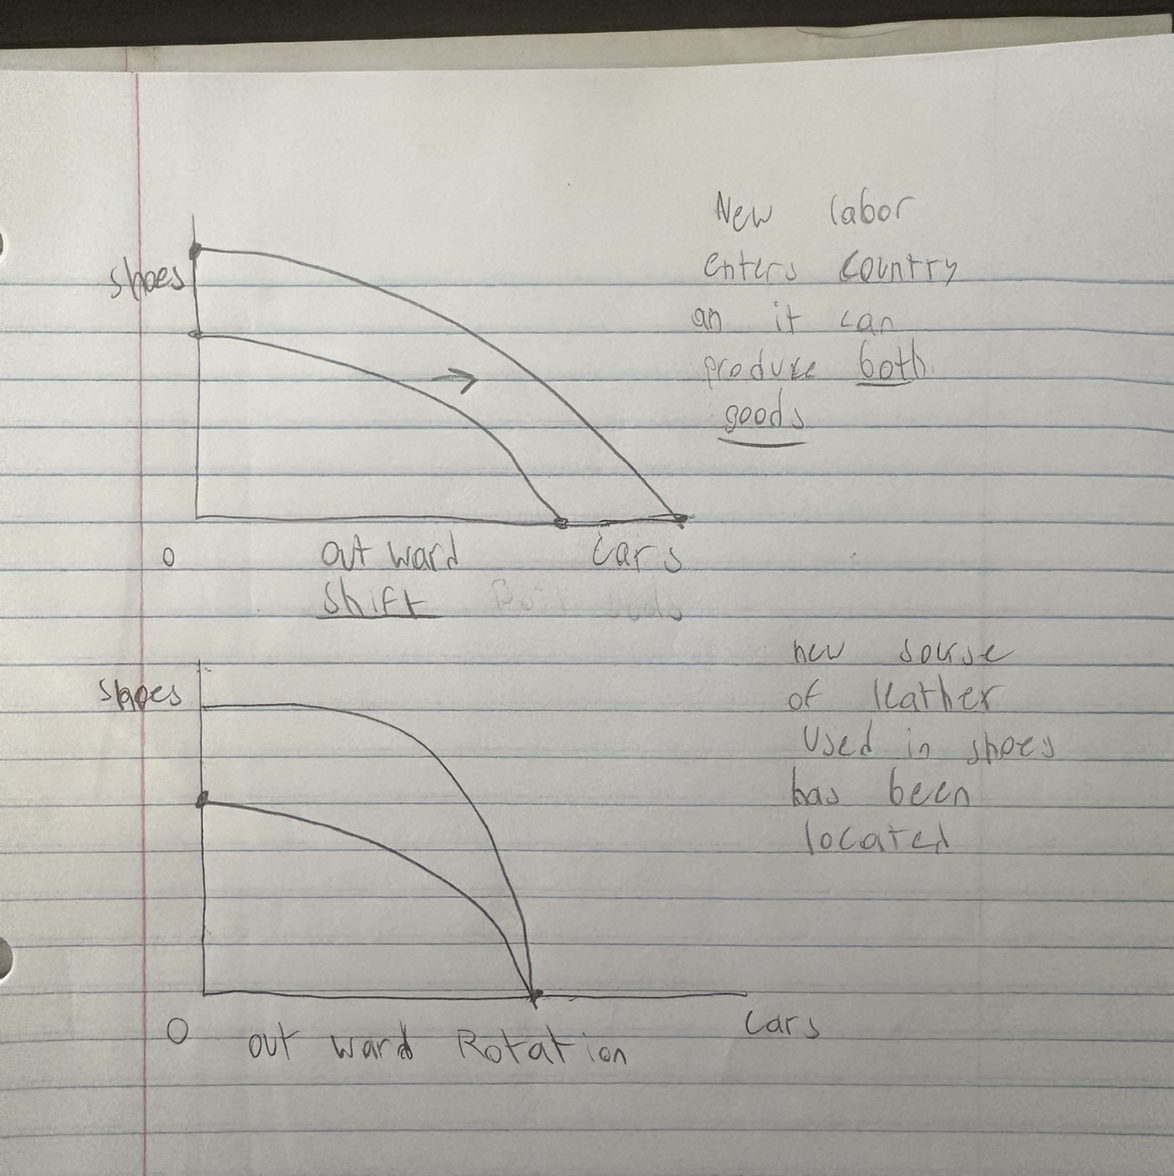
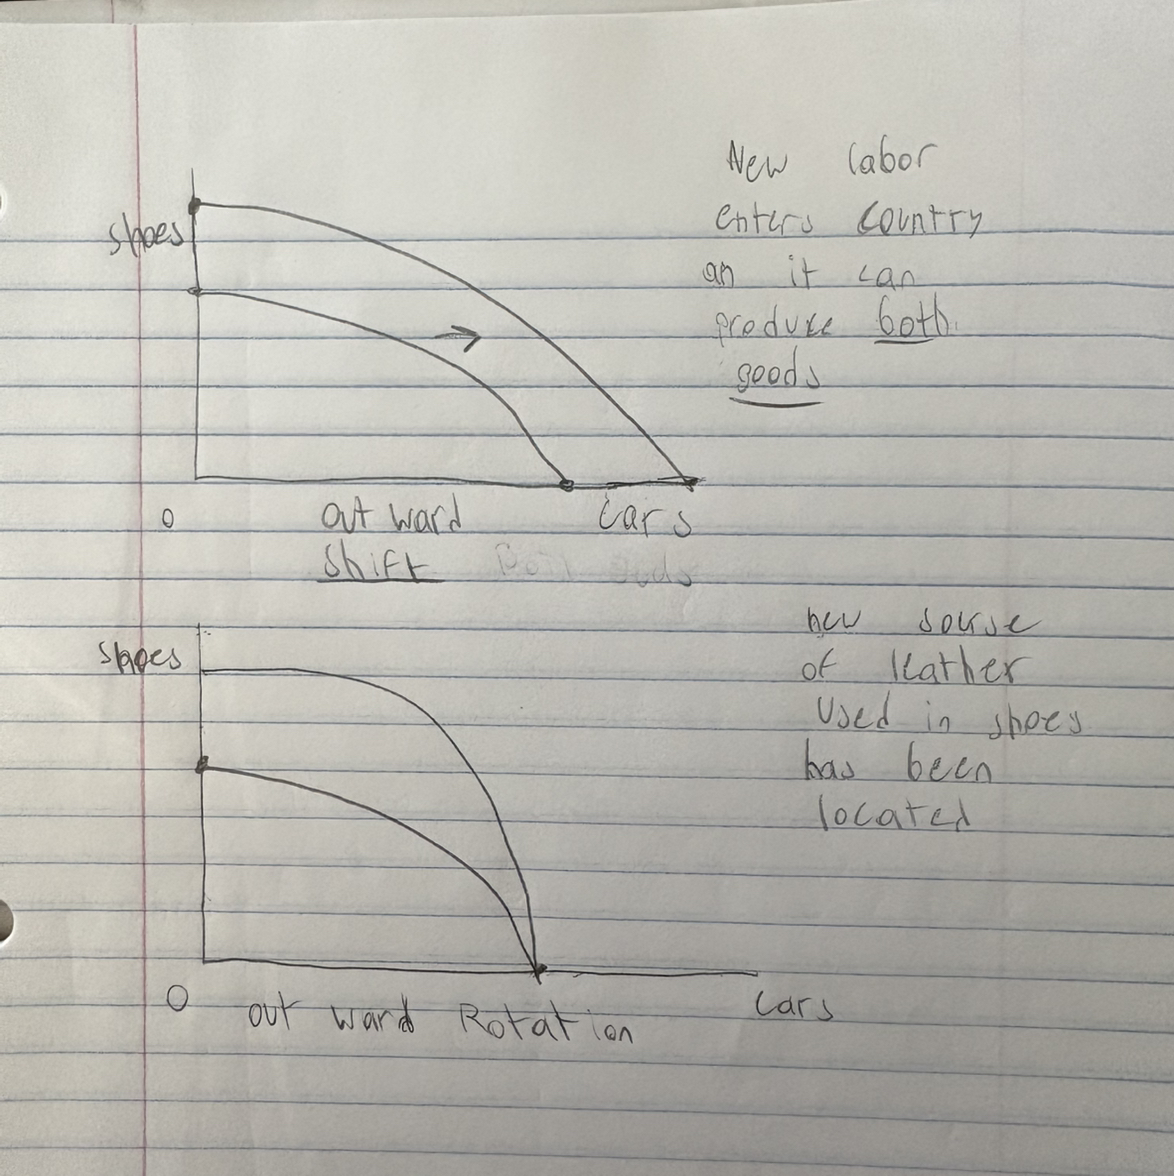
Shifts VS Rotations of PPF
A PPF will shift when the change in resources or technology affects the production of BOTH GOODS
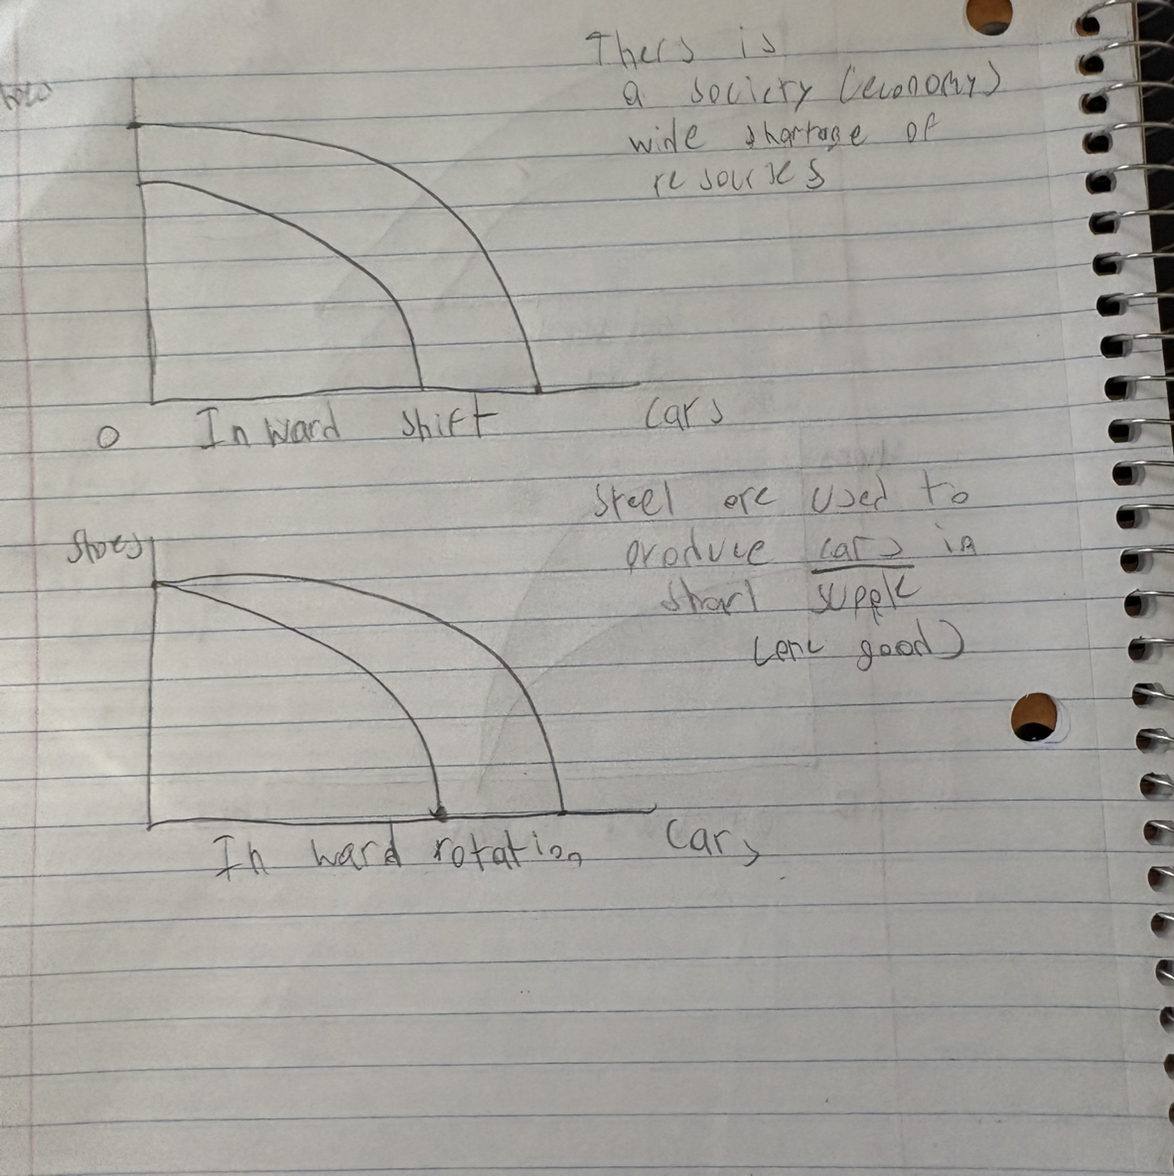
A PPF will rotate when the change in resources of technology affects the production of ONLY ONE GOOD
PPf will rotate out of the axis of the unaffected good
INCREASE —> Outward shift
DECREASE —> Inward Shift
A PPF will rotate when the change in resources of technology affects the production of ONLY ONE GOOD
Economic Models
P=A x M
P = Price level
M =Money supply
A = A composite of other factors, including real GDP, that change very slowly over time