203 CH6: Cost-Volume-Profit Relationships
LO:
1 Calculate the unit contribution margin and the contribution margin ratio
2 Use CVP analysis to find breakeven points and target profit volumes
3 Use CVP analysis to measure the impact of changing business conditions
4 Find breakeven and target profit volumes for multi-product companies
5 Determine a firm’s margin of safety, operating leverage, and most profitable cost structure
Introduction
CVP Analysis helps managers make important decisions
What products and services to offer, what prices to charge, what marketing strategy to use, and what cost structure to maintain
Primary purpose : estimate how profits are affected by the following five factors
Selling prices
Sales volume
Unit variable costs
Total fixed costs
Mix of products sold
Simplifying CVP calculations with assumptions
Selling price is constant; Price of product/service will not change as volume changes
Costs are linear and can be accurately divided into variable and fixed components
Variable costs are constant per unit; fixed costs are constant in total over the entire relevant range
In multi-product companies, the mix of products sold remains constant
*Inventories do not change; number of units produced equals the number of units sold
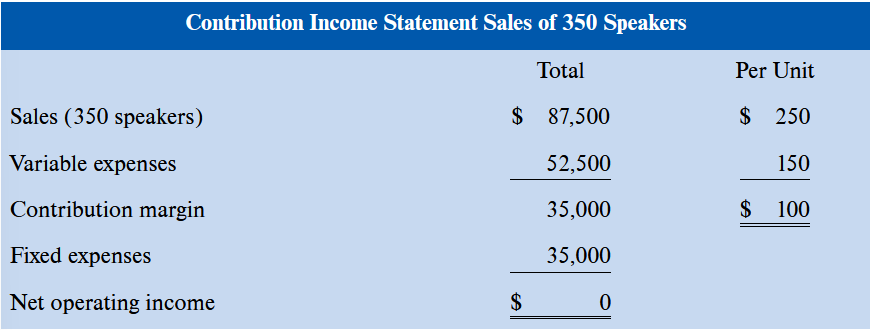
The Basics of Cost-Volume-Profit (CVP) Analysis
Contribution Margin
Contribution Margin : the amount remaining from sales revenue less variable expenses
Is the amount available to cover fixed expenses and then to provide profits for the period
Sequence
Cover fixed expense
Whatever remaining goes toward profits
If CM is not sufficient to cover fixed expenses, then loss occurs for the period
Break-even : neither profit nor loss but just covering expenses; the level of sales where profit is zero
Examples :
If sales = zero, company’s loss = fixed expenses
Each unit sold reduces loss by the amount of the unit contribution margin
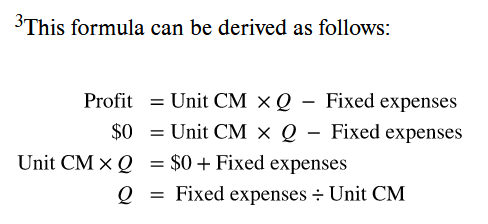
CVP Relationships in Equation Form
 Profit = net operating income (in equations)
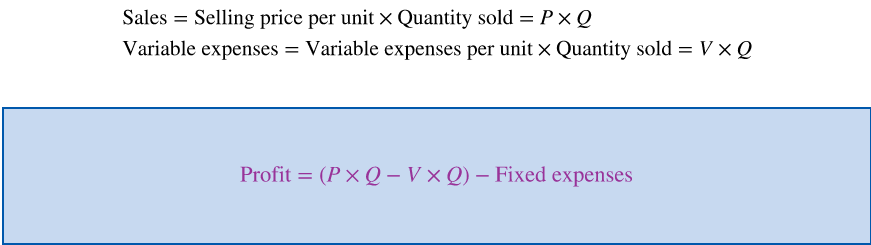 When company has single product, further refine equation
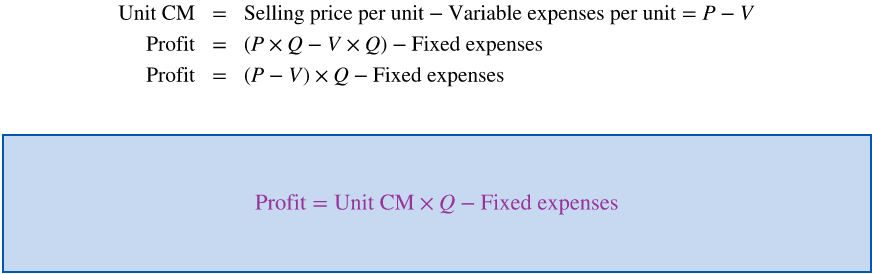
CVP Relationships in Graphic Form
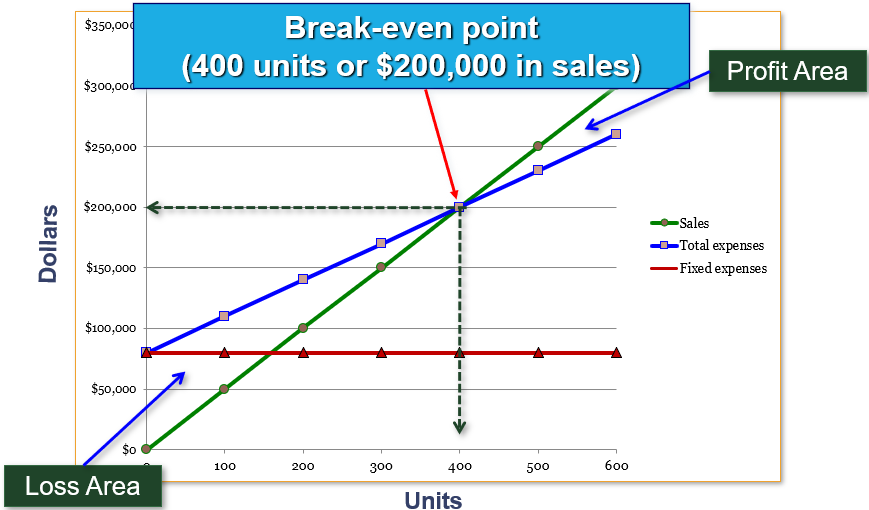
AKA break-even chart
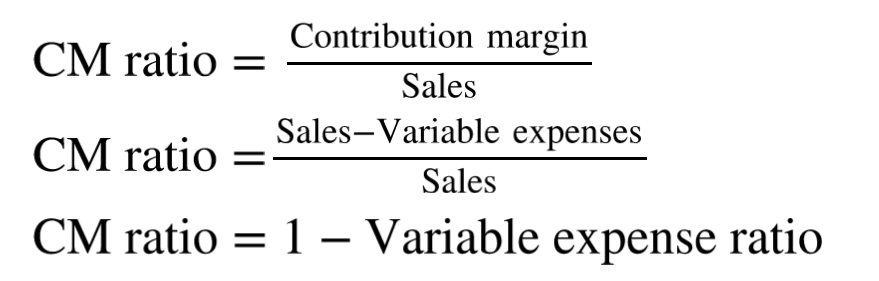
Contribution Margin Ratio (CM Ratio) and the Variable Expense Ratio
CM Ratio : contribution margin as a percentage of sales

Ex : CM ratio of 40% : for each dollar increase in sales, total CM will increase by 40 cents
Net operating income will also increase by 40 cents
Can be Total CM / Total Sales OR Unit CM / Unit Selling Price
Variable Expense Ratio : variable expenses as a percentage of sales

Can be Total VE / Total Sales OR VE per unit / Unit Selling Price
Mathematical Relation
Applications of the Contribution Margin Ratio
Change in contribution margin = CM ratio x Change in sales
Relation between profit and CM ratio
In terms of changes
Additional Applications of CVP Concepts
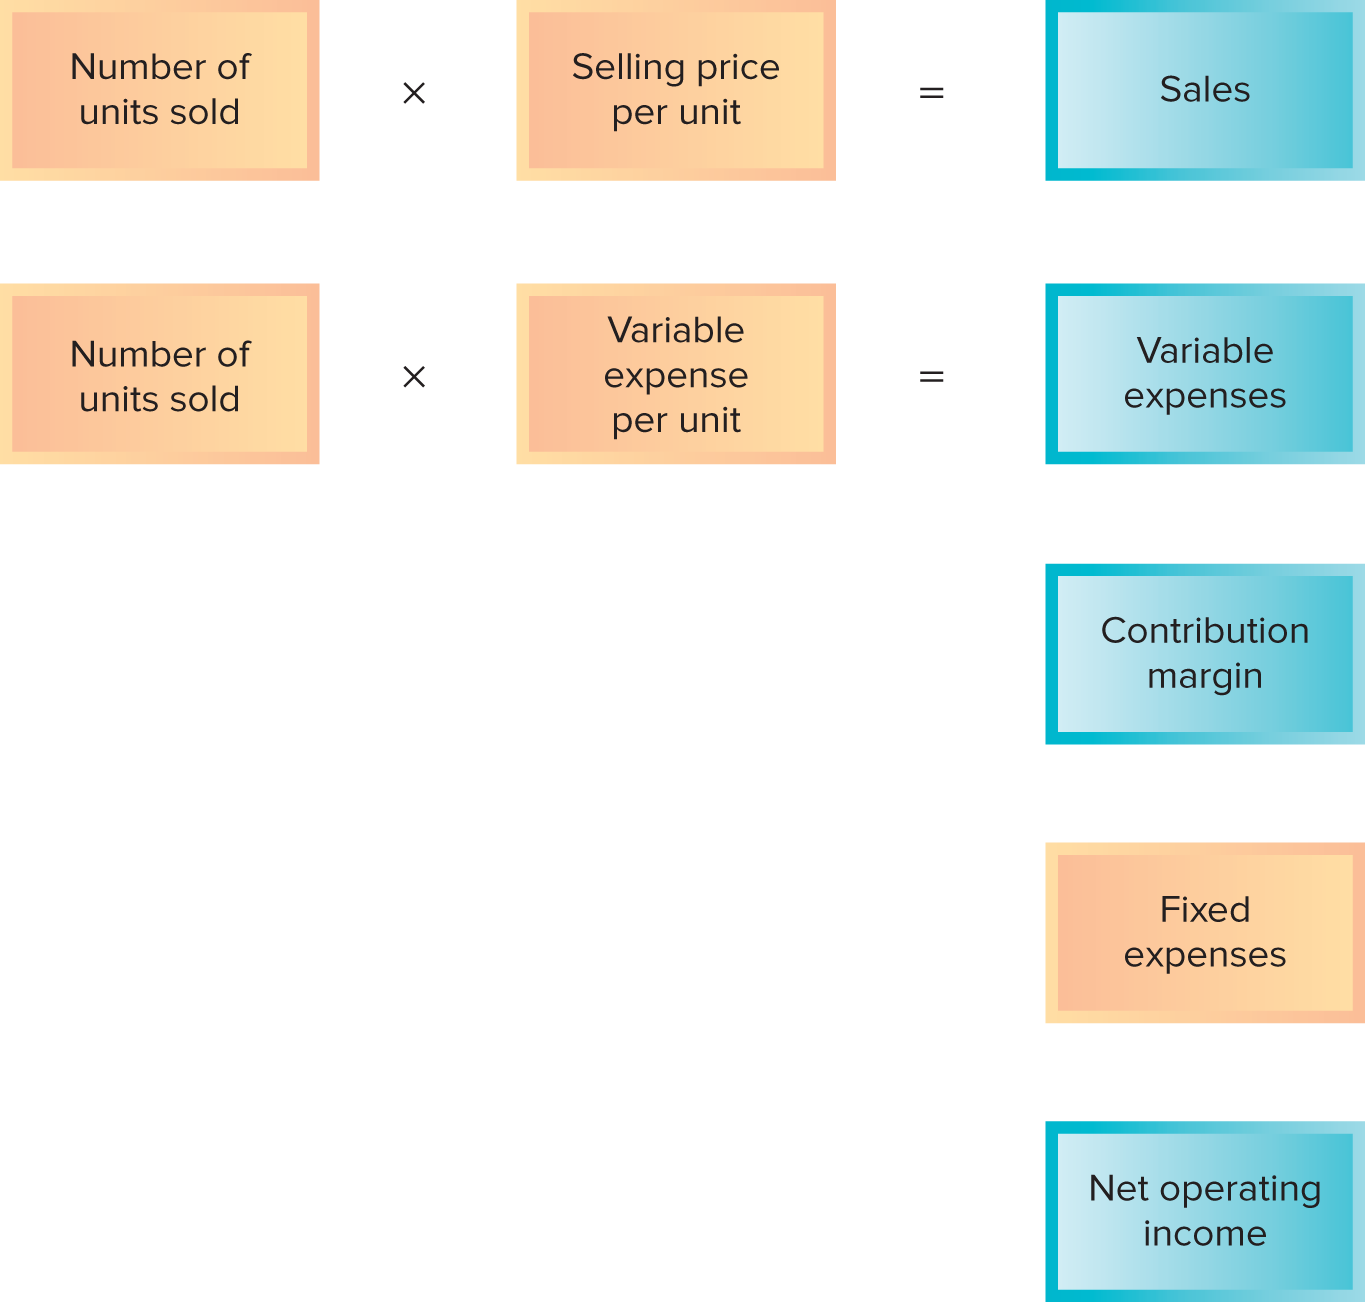
Sales less VE = CM
CM less FE = net operating income
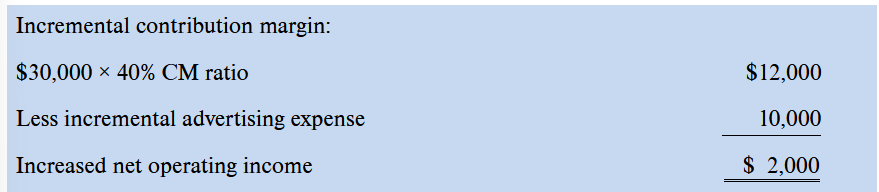
Incremental Analysis : consider only the costs and revenues that will change if a new program is implemented
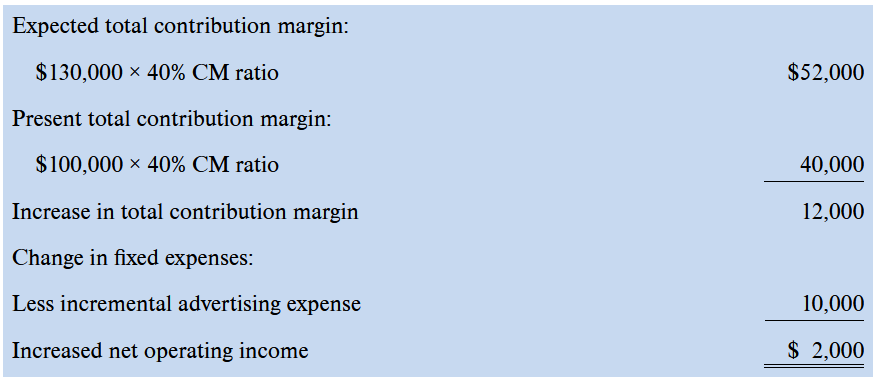
Ex : Change in Fixed Cost and Sales Volume
Z is currently selling 400 speakers per month at $250 per for total monthly sales of $100k. Sales manager feels a $10k increase in monthly advertising budget would increase monthly sales by $30k to a total of 520 units sold. Should advertising budget be increased?
Table that shows the financial impact of the proposed change
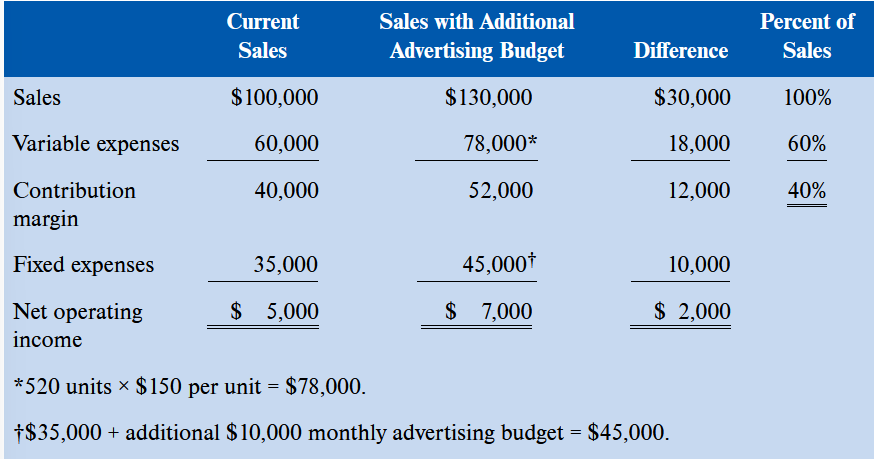 $150 is the previously stated VE per unit
Alternate Solution 1
Alternate Solution 2
Ex 2 : Change in Variable Costs and Sales Volume
Z is currently selling 400 speakers per month. They are considering the use of higher-quality components; which would increase variable costs (reducing contribution margin) by $10 per speaker. Sales manager predicts that using higher-quality components would increase sales to 480 sales per month. The $10 increase in variable costs would decrease the unit contribution margin by $10—from $100 down to $90. Should the higher-quality components be used?
Solution
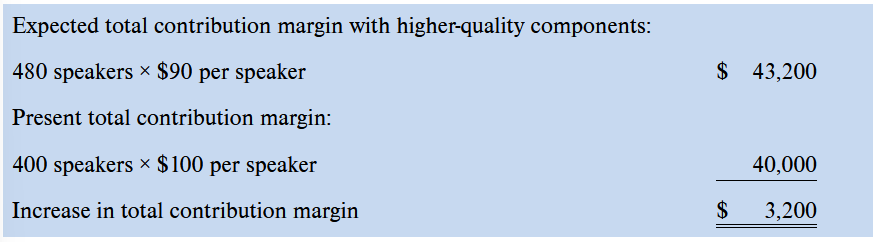 Because fixed costs would not change, the $3.2k increase in CM should result in a $3.2k increase in net operating income
Ex 3 : Change in Fixed Cost, Selling Price, and Sales Volume
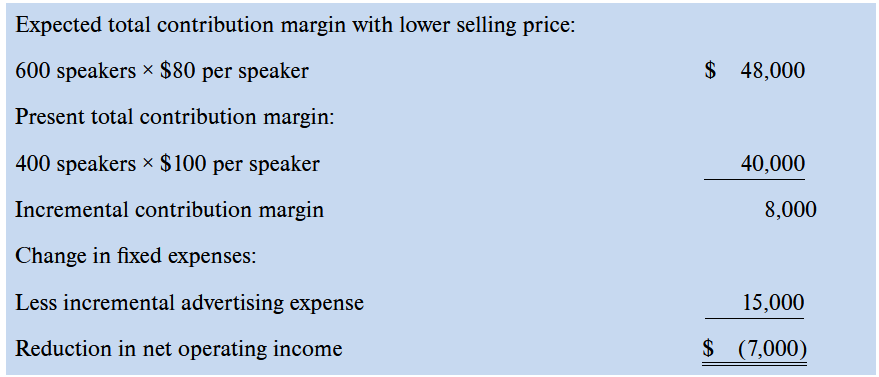
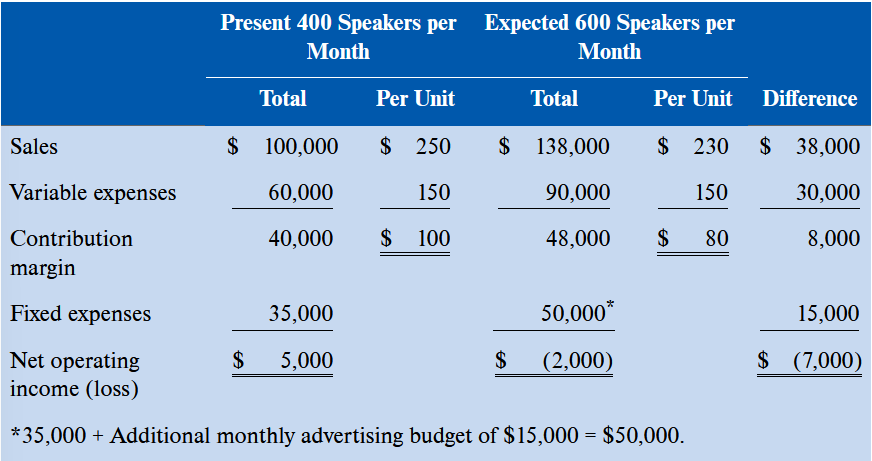
Z currently sells 400 speakers per months. To increase sales, the sales manager would like to decrease selling price by $20 per speaker and increase the advertising budget by $15k per month. Sales manager believes if these two steps are taken, unit sales will increase by 50% to 600 speakers per month. A decrease in the selling price of $20 per speaker would decrease the unit contribution margin by $20 down to $80
Solution
Ex 4 : Change in Variable Cost, Fixed Cost, and Sales Volume
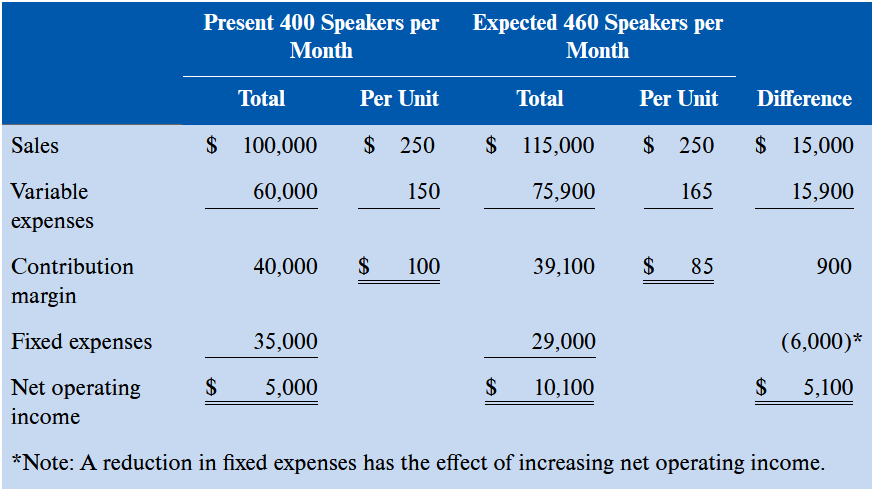
Still, Z is currently selling 400 speakers per month. Sales manager would like to pay salespersons a sales commission of $15 per speaker sold, rather than the flat salaries that now total $6k per month. The sales manager is confident that the change would increase the monthly sales volume by 15 percent to 460 speakers per month. Should the change be made?
Solution
Changing sales staff’s compensation from salaries to commissions affects both variable and fixed expenses. Variable expenses per unit would by $15, from $150 to $165, and unit CM would decrease from $100 to $85. Fixed expenses would decrease by $6k, from $35k to $29k

Ex 5 : Change in Selling Price
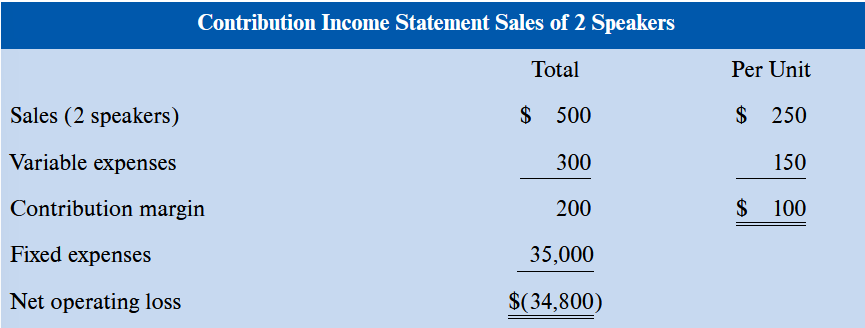
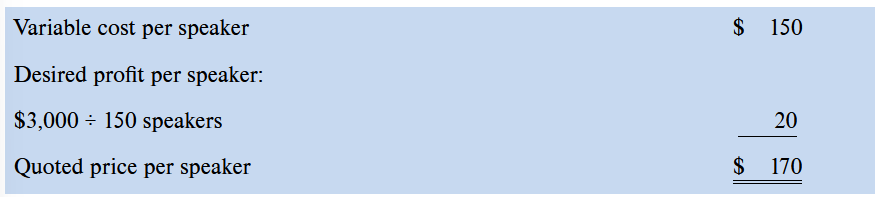
Z has an opportunity to make a bulk sale of 150 speakers to a wholesaler if an acceptable price can be negotiated. This sale would not alter the company’s regular sales and would not affect the company’s total fixed expenses. What price per speaker should be quoted to the wholesaler if Z is seeking a profit of $3k on the bulk sale
Solution


Break-Even and Target Profit Analysis
Break-Even Analysis
Break-even : the level of sales at which the company’s profit is zero
The Equation Method
-
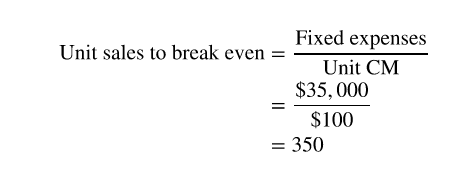
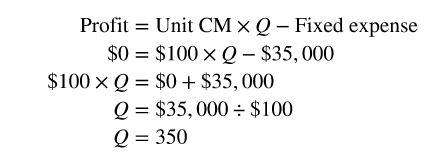 Z will break even at a sales volume of 350 speakers per month
The Formula Method
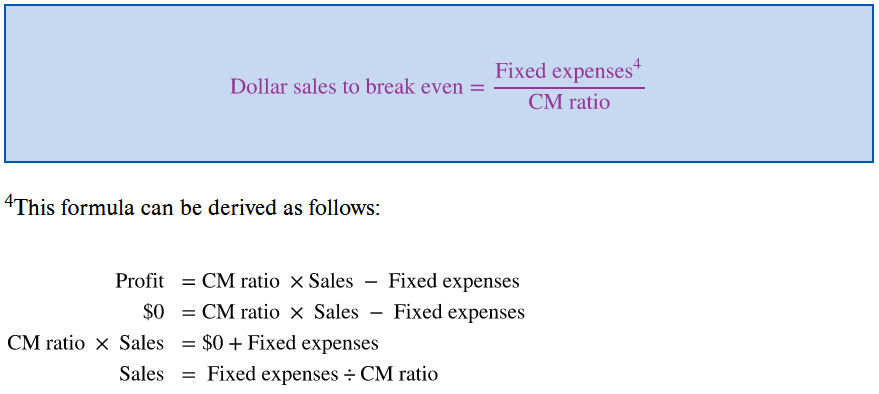
Break-Even in Dollar Sales
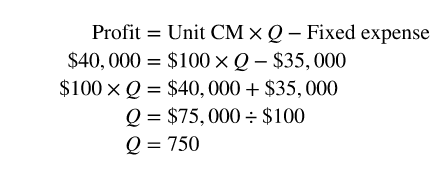
Target Profit Analysis
Estimating the level of sales needed to achieve a desired target profit
The Equation Method
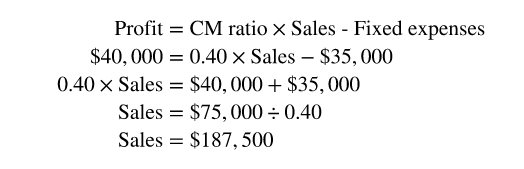
The Formula Method
Target Profit Analysis in Terms of Dollar Sales
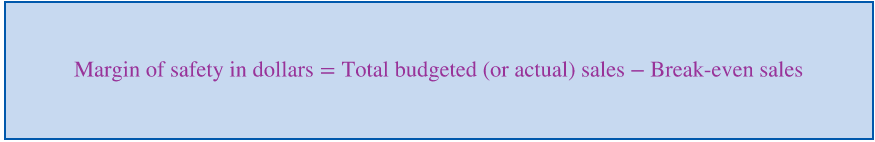
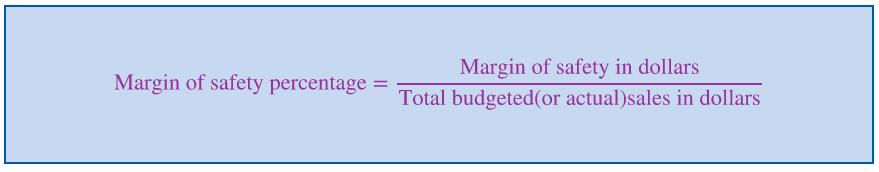
The Margin of Safety
Margin of Safety : the excess of budgeted or actual sales dollars over the break-even sales dollar


CVP Considerations in Choosing a Cost Structure
Cost Structure and Profit Stability
Which cost structure is better — high variable costs and low fixed costs or the opposite?
Depends on many factors
Long-run trend in sales
Year-to-year fluctuations in the level of sales
Attitude of owners toward risk
If CM ratio is higher, profits will increase more rapidly
Operating Leverage
Operating leverage : a measure of how sensitive net operating income is to a given percentage in unit sales
Acts as a multiplier
If OL is high, a small percentage increase in unit sales can produce a much larger percentage increase in net operating income
 a measure, at a given level of sales, of how a percentage change in sales volume will affect profits
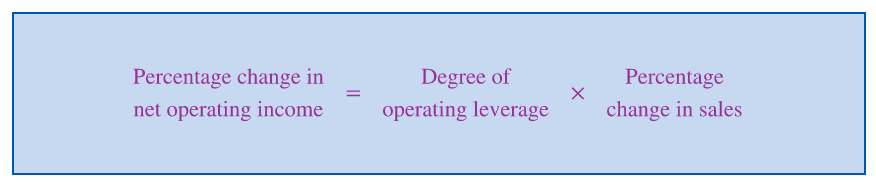
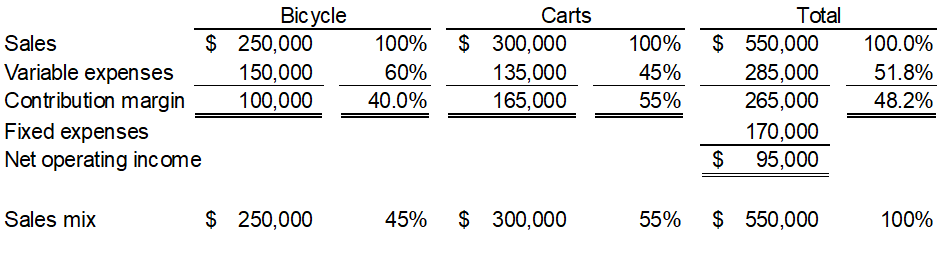
Sales Mix
The Definition of Sales Mix
Sales mix : the relative proportions in which a company’s products are sold
Goal : Yield the greatest profits
Different products have different selling prices, cost structures, and contribution margins
 PP97
PP97
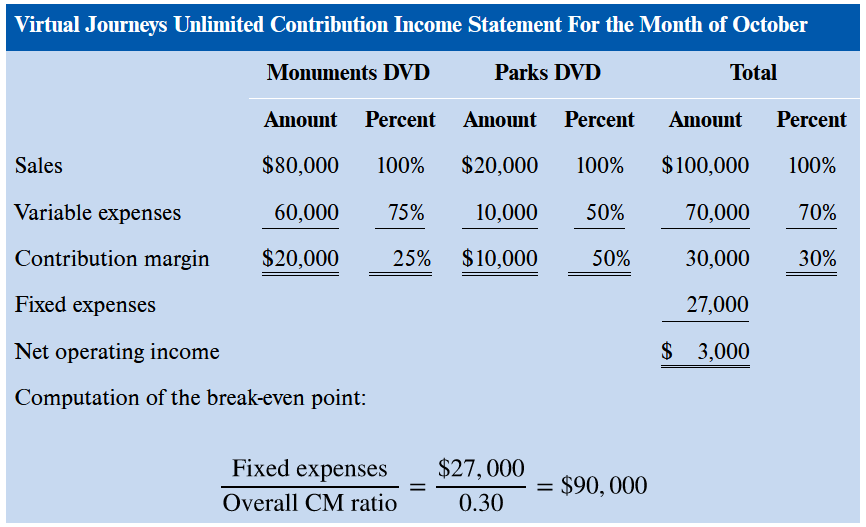
Sales Mix and Break-Even Analysis
Analyzing Mixed Costs
Diagnosing Cost Behavior with a Scatter Graph Plot
The High-Low Method
The Least-Squares Regression Method
Comparing the High-Low and Least-Squares Regression Methods