Macroeconmics Final
% change= (diff/original)100
(51.25-46.25/46.25)100
(5/46.25)100=10.8%
Most essential things in Macro:
- Opportunity cost
- Macro v. Micro
- Welcome to Economics
- Introduction
- Information Overload in the Information Age
- What Is Economics and Why Is it Important?
- Economics studies how humans make decisions in the face of scarcity.
- Scarcity means that human wants for goods, services, and resources exceed what is available.
- Introduction to FRED
- FRED website (https://openstax.org/l/FRED/)
- Money, Banking, and Finance
- Population, Employment, and Labour Markets (Including Income Distribution)
- National Account (Gross Domestic Product and Its Components), Flow of Funds, and International Accounts
- Production and Business Activity (Including Business Cycles)
- Prices and Inflation (Including the Consumer Price Index, the Producer Price Index, and the Employment Cost Index)
- International Data From Other Nations
- US Regional Data
- Academic Data (Including Penn World Tables and NBER Macrohistory Database)
- Videos (https://openstax.org/l/FRED_intro)
- FRED website (https://openstax.org/l/FRED/)
- The Problem With Scarcity
- website (http://openstax.org/l/drought)
- Division and Specialisation of Labour
- In the first chapter, Smith introduces the division of labour, which means separating how one produces a good or service into several tasks that different workers perform instead of one person doing all the jobs.
- Why Division of Labour Increases Production
- First, specialisation in a particular small job allows workers to focus on parts of the production process where they have an advantage.
- Third, specialisation allows business to take advantage of economies of scale, which means that for many goods, as the level of production increases, the average cost of producing each individual unit declines.
- Trade and Markets
- As you can see, economics affects far more than business. For example:
- Virtually every major problem facing the world today, from global warming, to world poverty, to the conflicts in Syria, Afghanistan, and Somalia, has an economic dimension. If you are going to be part of solving those problems, you need to be able to understand them. Economics is crucial.
- It is hard to overstate the importance of economics to good citizenship. You need to be able to vote intelligently on budgets, regulations, and laws in general. When the U.S. government came close to a standstill at the end of 2012 due to the “fiscal cliff,” what were the issues? Did you know?
- A basic understanding of economics makes you a well-rounded thinker. When you read articles about economic issues, you will understand and be able to evaluate the writer’s argument. When you hear classmates, co-workers, or political candidates talking about economics, you will be able to distinguish between common sense and nonsense. You will find new ways of thinking about current events and about personal and business decisions, as well as current events and politics.
- As you can see, economics affects far more than business. For example:
- Microeconomics and Macroeconomics
- We can divide that ground into two parts:
- Microeconomics focuses on the actions of individual agents within the economy, like households, workers, and businesses.
- Macroeconomics looks at the economy as a whole.
- Microeconomics
- Macroeconomics
- A nation's central bank conducts monetary policy, which involves policies that affect bank lending, interest rates, and financial capital markets.
- A nation's legislative body determines fiscal policy, which involves government spending and taxes.
- We can divide that ground into two parts:
- How Economists Use Theories and Models to Understand Economic Issues
- A theory is a simplified representation of how two or more variables interact with each other.
- Sometimes economists use the term model instead of theory.
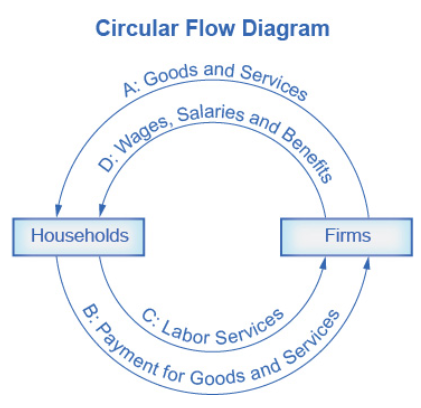
- A good model to start with in economics is the circular flow diagram.
- It pictures the economy as consisting of two groups—households and firms—that interact in two markets: the goods and services market in which firms sell and households buy and the labor market in which households sell labor to business firms or other employees.
- How To Organize Economies:
- An Overview of Economic Systems
- The first is the traditional economy, which is the oldest economic system and is used in parts of Asia, Africa, and South America
- In a command economy, economic effort is devoted to goals passed down from a ruler or ruling class.
- A market is an institution that brings together buyers and sellers of goods or services, who may be either individuals or businesses.
- In a market economy, decision-making is decentralized. Market economies are based on private enterprise: the private individuals or groups of private individuals own and operate the means of production (resources and businesses).
- Regulations:
- The Rules of the Game
- Heavily regulated economies often have underground economies (or black markets), which are markets where the buyers and sellers make transactions without the government’s approval.
- The Rules of the Game
- The Rise of Globalization
- Recent decades have seen a trend toward globalization, which is the expanding cultural, political, and economic connections between people around the world.
- Exports are the goods and services that one produces domestically and sells abroad. Imports are the goods and services that one has abroad and then sells domestically. Gross domestic product (GDP) measures the size of total production in an economy.
- Information Overload in the Information Age
- An Overview of Economic Systems
- Introduction
- Choice in a World of Scarcity
- Introduction to Choice in a World of Scarcity
- Preferences... to What Degree?
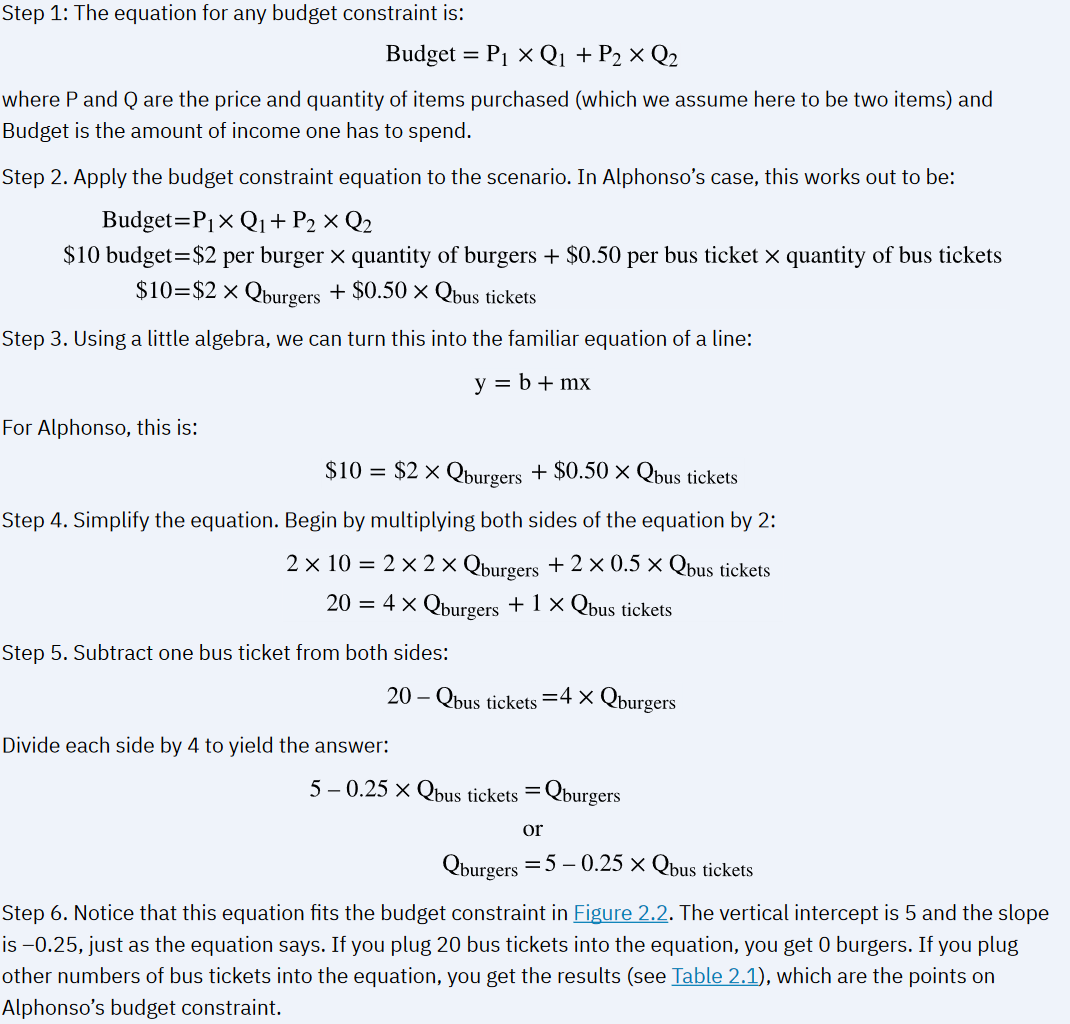
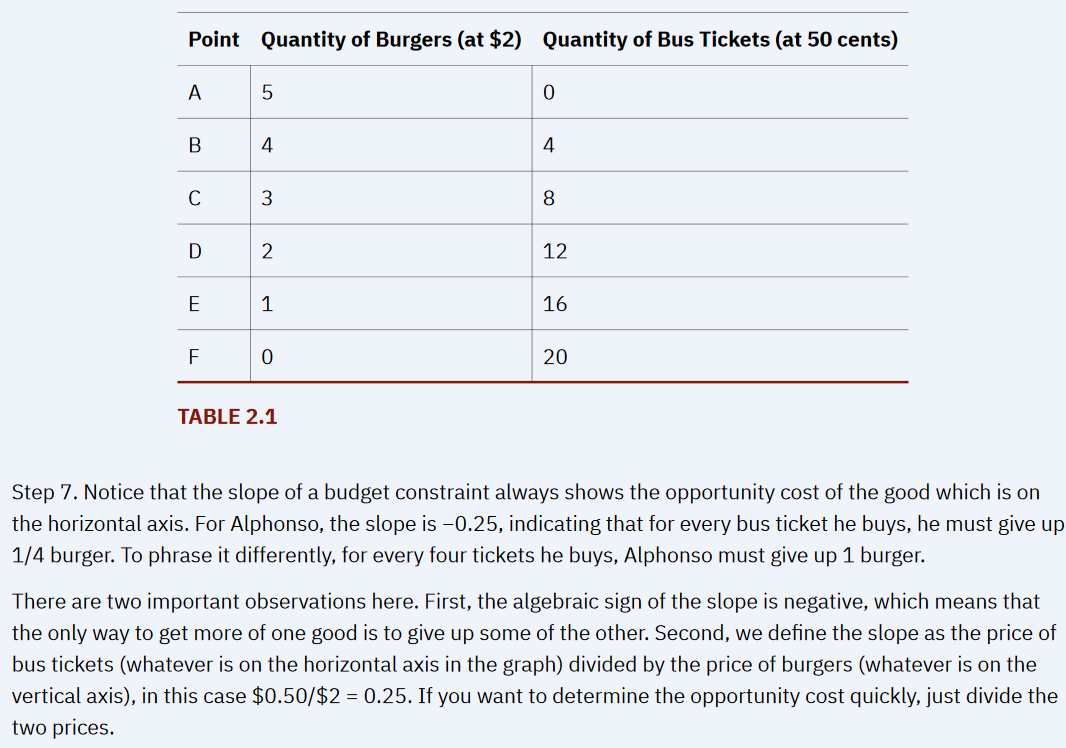
- How Individuals Make Choices Based on Their Budget Constraints
- We get Alphonso's budget constraint if we connect all the points between A and F.
- The Concept of Opportunity Cost
- Economists use the term opportunity cost to indicate what people must give up to obtain their desires.
- website (http://openstax.org/l/linestanding)
- Understanding Budget Constraints
- Identifying Opportunity Cost
- What is the opportunity cost associated with increased airport security measures?
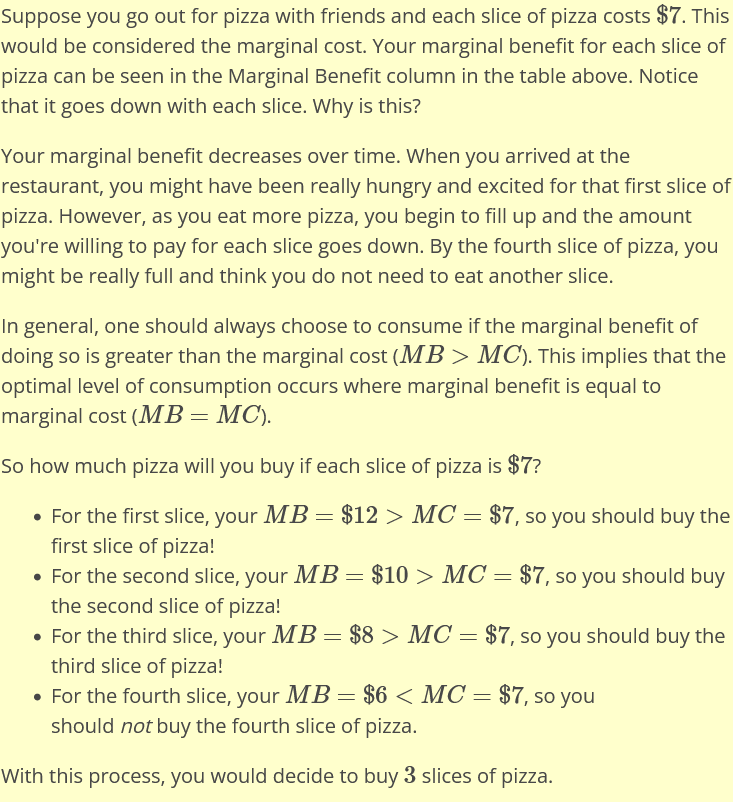
- Marginal Decision-Making and Diminishing Marginal Utility
- Instead, most choices involve marginal analysis, which means examining the benefits and costs of choosing a little more or a little less of a good.
- We now turn to the notion of utility.
- Economists refer to this pattern as the law of diminishing marginal utility, which means that as a person receives more of a good, the additional (or marginal) utility from each additional unit of the good declines.
- Sunk Costs
- Thus, the budget constraint framework assumes that sunk costs, which are costs that were incurred in the past and cannot be recovered, should not affect the current decision.
- From a Model with Two Goods to One of Many Goods
- The Production Possibilities Frontier and Social Choices
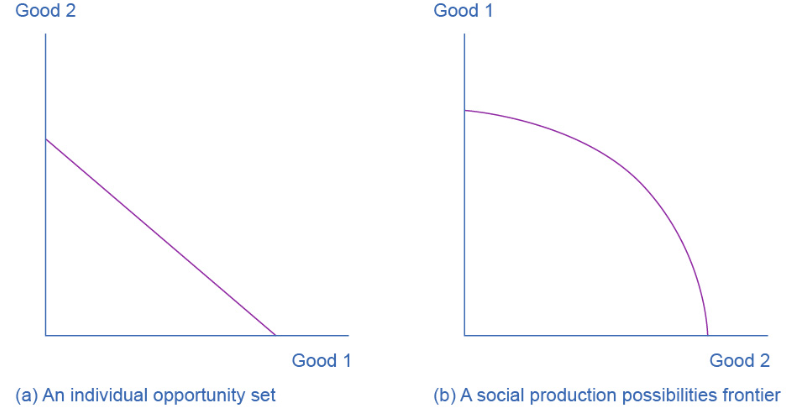
- This section of the chapter will explain the constraints society faces, using a model called the production possibilities frontier (PPF).
- Just as with Alphonso’s budget constraint, the slope of the production possibilities frontier shows the opportunity cost.
- What’s the difference between a budget constraint and a PPF?
- The PPF and the Law of Increasing Opportunity Cost
- The reason for these straight lines was that the relative prices of the two goods in the consumption budget constraint determined the slope of the budget constraint.
- This pattern is common enough that economists have given it a name:
- The law of increasing opportunity cost, which holds that as production of a good or service increases, the marginal opportunity cost of producing it increases as well.
- Productive Efficiency and Allocative Efficiency
- Productive efficiency means that, given the available inputs and technology, it is impossible to produce more of one good without decreasing the quantity that is produced of another good.
- Allocative efficiency means that the particular combination of goods and services on the production possibility curve that a society produces represents the combination that society most desires.
- Why Society Must Choose
- The PPF and Comparative Advantage
- When a country can produce a good at a lower opportunity cost than another country, we say that this country has a comparative advantage in that good.
- Confronting Objections to the Economic Approach
- First Objection:
- People, Firms, and Society Do Not Act Like This
- Second Objection:
- People, Firms, and Society Should Not Act This Way
- Philosophers draw a distinction between positive statements, which describe the world as it is, and normative statements, which describe how the world should be.
- People, Firms, and Society Should Not Act This Way
- Is a diagram by any other name the same?
- Adam Smith, writing in The Wealth of Nations, named this property the invisible hand.
- Choices ... to What Degree?
- First Objection:
- Introduction to Choice in a World of Scarcity
- Demand and Supply
- Introduction to Demand and Supply
- Why Can We Not Get Enough of Organic Foods?
- This website (http://openstax.org/l/celebauction)
- Demand, Supply, and Equilibrium in Markets for Goods and Services
- Demand for Goods and Services
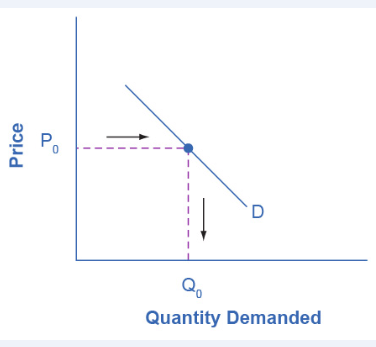
- Economists use the term demand to refer to the amount of some good or service consumers are willing and able to purchase at each price.
- What a buyer pays for a unit of the specific good or service is called price. The total number of units that consumers would purchase at that price is called the quantity demanded.
- Economists call this inverse relationship between price and quantity demanded the law of demand.
- Economist call a table that shows the quantity demanded at each price, such as Table 3.1, a demand schedule.
- A demand curve shows the relationship between price and quantity demanded on a graph like Figure 3.2, with quantity on the horizontal axis and the price per gallon on the vertical axis. (Note that this is an exception to the normal rule in mathematics that the independent variable (x) goes on the horizontal axis and the dependent variable (y) goes on the vertical axis. Economics is not math.)
- Is demand the same as quantity demanded?
- Supply of Goods and Services
- When economists talk about supply, they mean the amount of some good or service a producer is willing to supply at each price.
- A rise in price almost always leads to an increase in the quantity supplied of that good or service, while a fall in price will decrease the quantity supplied.
- Economists call this positive relationship between price and quantity supplied—that a higher price leads to a higher quantity supplied and a lower price leads to a lower quantity supplied—the law of supply.
- Is supply the same as quantity supplied?
- A supply schedule is a table, like Table 3.2, that shows the quantity supplied at a range of different prices.
- A supply curve is a graphic illustration of the relationship between price, shown on the vertical axis, and quantity, shown on the horizontal axis.
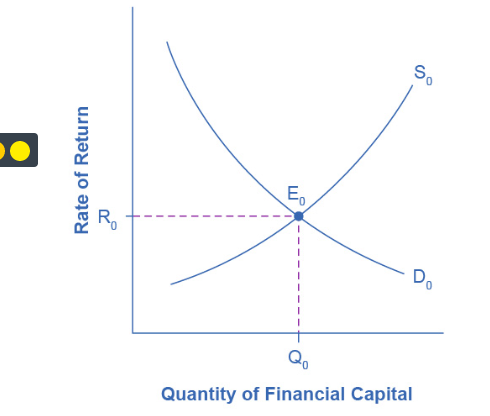
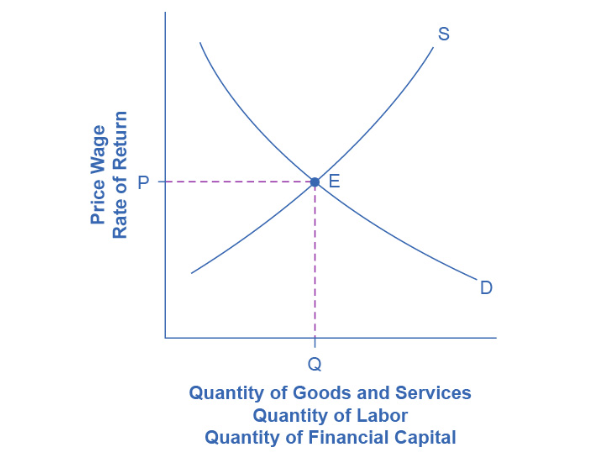
- Equilibrium
- Where Demand and Supply Intersect
- The point where the supply curve (S) and the demand curve (D) cross, designated by point E in Figure 3.4, is called the equilibrium. The equilibrium price is the only price where the plans of consumers and the plans of producers agree
- That is, where the amount of the product consumers want to buy (quantity demanded) is equal to the amount producers want to sell (quantity supplied). Economists call this common quantity the equilibrium quantity.
- We call this an excess supply or a surplus.
- When the price is below equilibrium, there is excess demand, or a shortage
- That is, at the given price the quantity demanded, which has been stimulated by the lower price, now exceeds the quantity supplied, which has been depressed by the lower price.
- Demand for Goods and Services
- Shifts in Demand and Supply for Goods and Services
- website (https://openstax.org/l/toothfish)
- What Factors Affect Demand?
- The Ceteris Paribus Assumption
- Economists call this assumption ceteris paribus, a Latin phrase meaning “other things being equal.”
- When does ceteris paribus apply?
- How Does Income Affect Demand?
- A product whose demand rises when income rises, and vice versa, is called a normal good.
- A product whose demand falls when income rises, and vice versa, is called an inferior good.
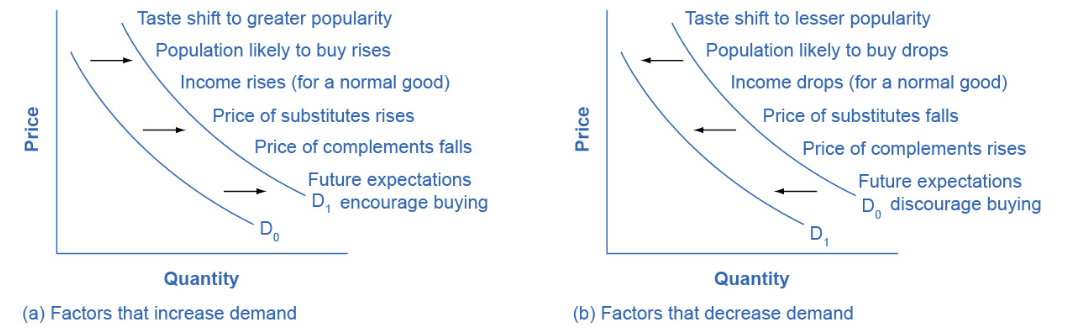
- Other Factors That Shift Demand Curves
- Changing Tastes or Preferences
- Changes in the Composition of the Population
- Changes in the Prices of Related Goods
- A substitute is a good or service that we can use in place of another good or service.
- Other goods are complements for each other, meaning we often use the goods together, because consumption of one good tends to enhance consumption of the other
- Changes in Expectations about Future Prices or Other Factors that Affect Demand
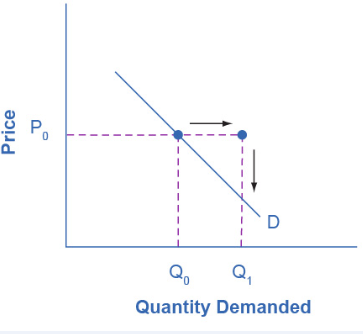
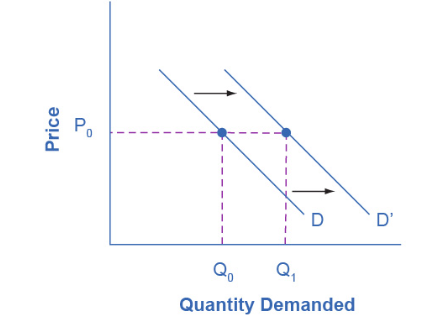
- Therefore, a shift in demand happens when a change in some economic factor (other than price) causes a different quantity to be demanded at every price
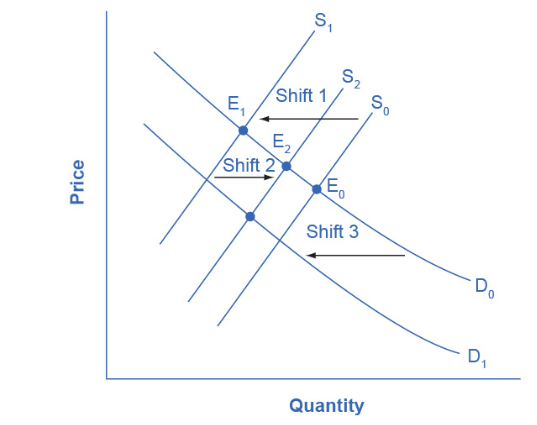
- Shift in Demand
- Summing Up Factors That Change Demand
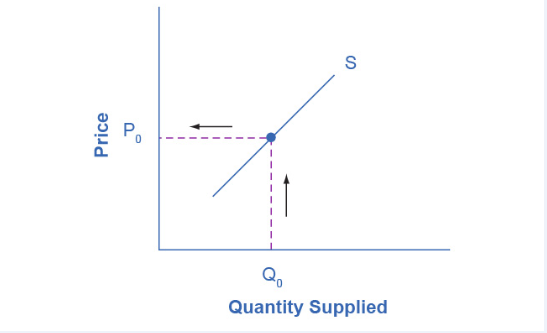
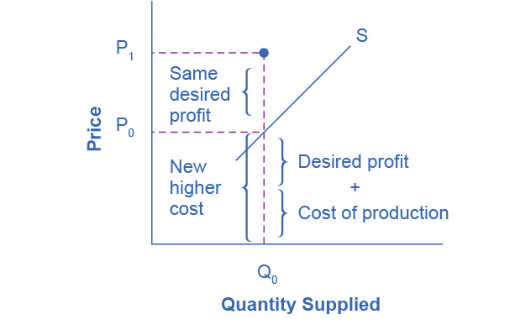
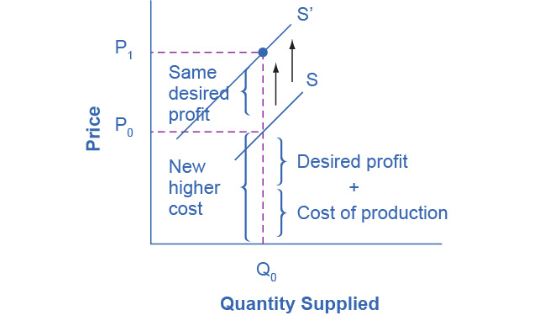
- How Production Costs Affect Supply
- Just as we described a shift in demand as a change in the quantity demanded at every price, a shift in supply means a change in the quantity supplied at every price.
- A firm produces goods and services using combinations of labor, materials, and machinery, or what we call inputs or factors of production.
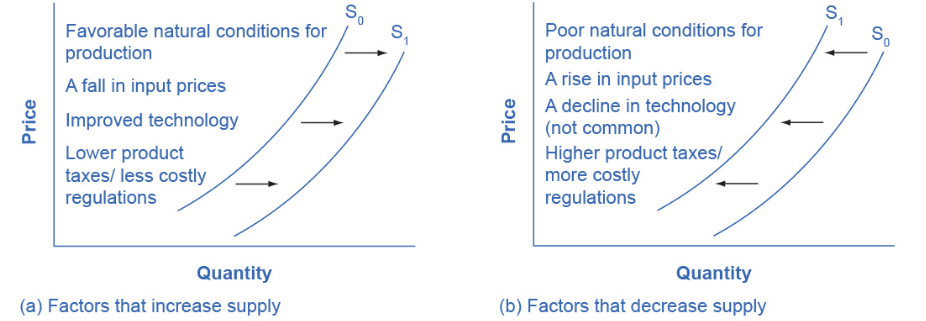
- Other Factors That Affect Supply
- Shift in Supply
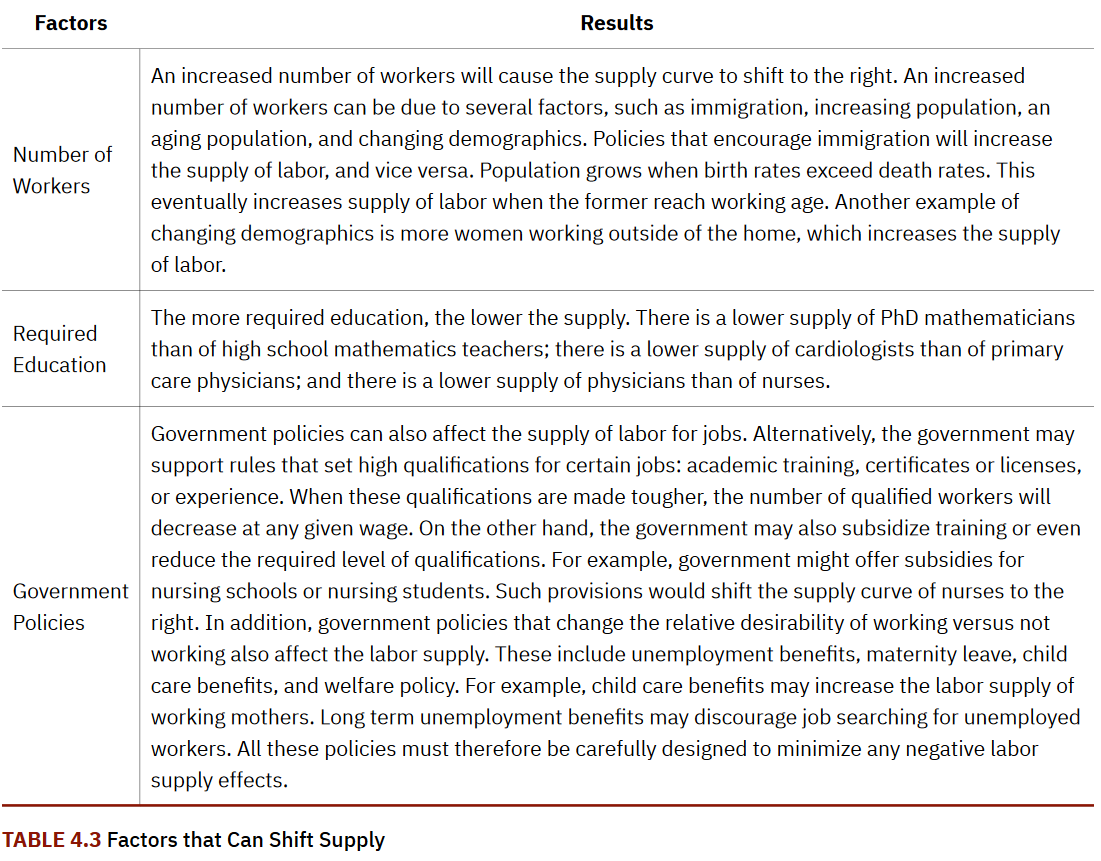
- Summing Up Factors That Change Supply
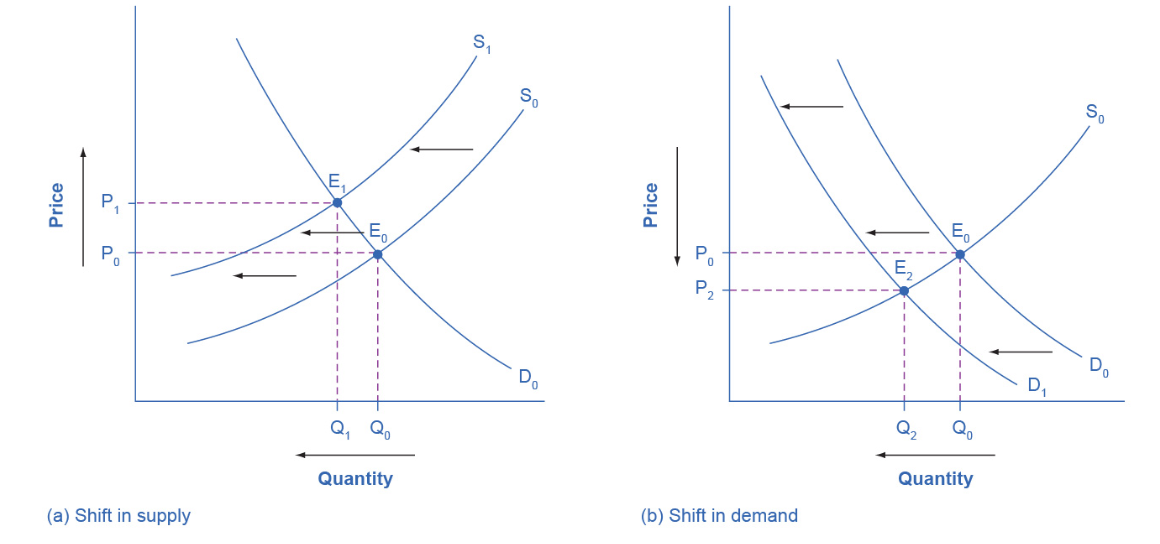
- Changes in Equilibrium Price and Quantity: The Four-Step Process
- Good Weather for Salmon Fishing
- Newspapers and the Internet
- The Interconnections and Speed of Adjustment in Real Markets
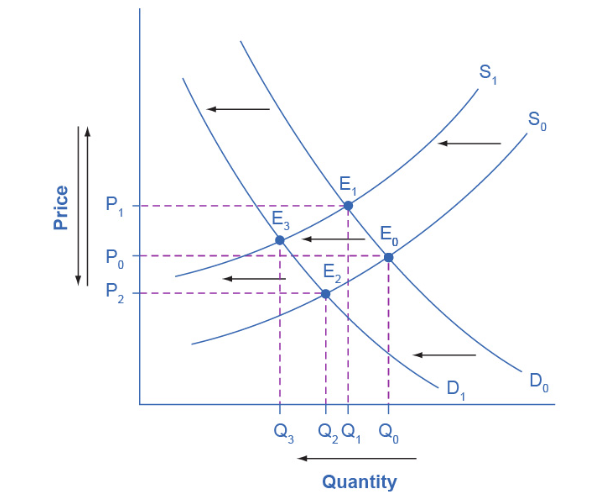
- A Combined Example
- What is the difference between shifts of demand or supply versus movements along a demand or supply curve?
- Price Ceilings and Price Floors
- Price Ceilings
- Laws that governments enact to regulate prices are called price controls.
- A price ceiling keeps a price from rising above a certain level (the “ceiling”), while a price floor keeps a price from falling below a given level (the “floor”).
- Price Floors
- Price Ceilings
- Demand, Supply, and Efficiency
- Consumer Surplus, Producer Surplus, Social Surplus
- The amount that individuals would have been willing to pay, minus the amount that they actually paid, is called consumer surplus.
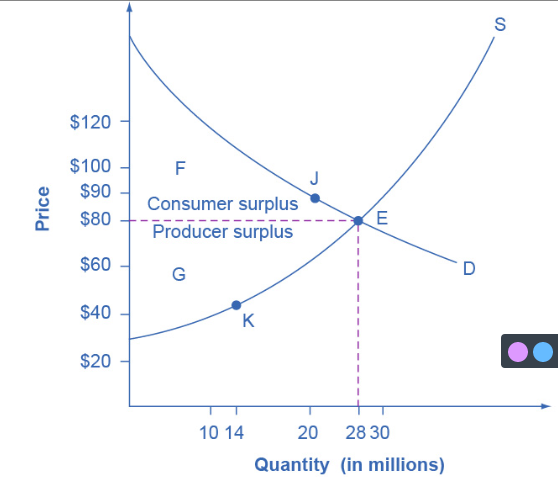
- The extra benefit producers receive from selling a good or service, measured by the price the producer actually received minus the price the producer would have been willing to accept is called producer surplus.
- The sum of consumer surplus and producer surplus is social surplus, also referred to as economic surplus or total surplus.
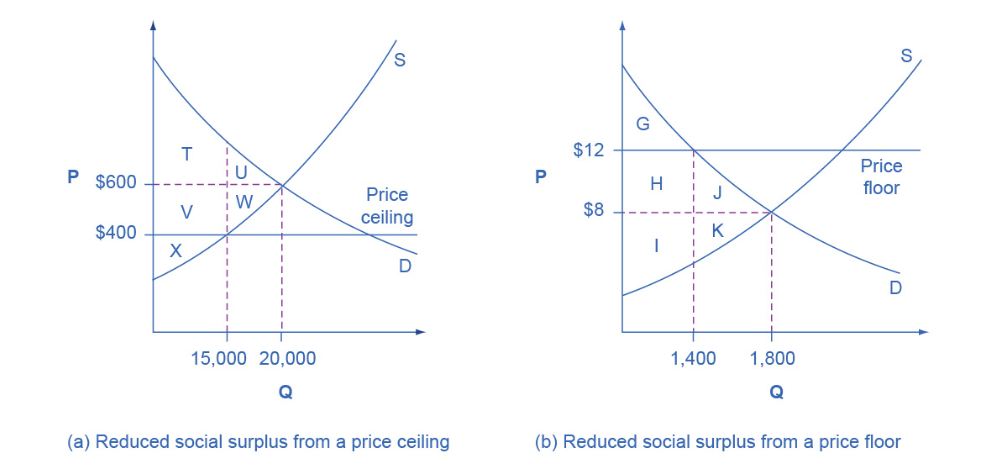
- Inefficiency of Price Floors and Price Ceilings
- The loss in social surplus that occurs when the economy produces at an inefficient quantity is called deadweight loss.
- Demand and Supply as a Social Adjustment Mechanism
- Why Can We Not Get Enough of Organic Food?
- Consumer Surplus, Producer Surplus, Social Surplus
- Introduction to Demand and Supply
- Labor and Financial Markets
- Introduction to Labor and Financial Markets
- Baby Boomers Come of Age
- Demand and Supply at Work in Labor Markets
- The law of demand applies in labor markets this way:
- A higher salary or wage
- That is, a higher price in the labor market
- A higher salary or wage
- The law of demand applies in labor markets this way:
- Introduction to Labor and Financial Markets
Leads to a decrease in the quantity of labor demanded by employers, while a lower salary or wage leads to an increase in the quantity of labor demanded.
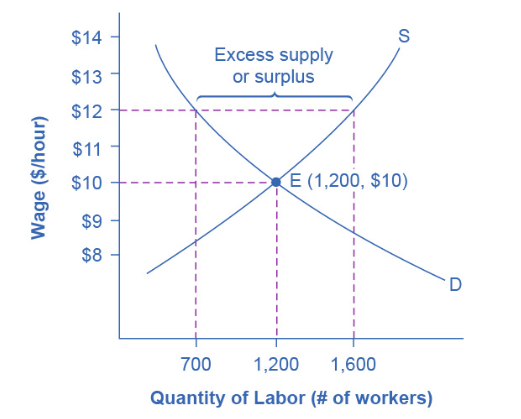
- Equilibrium in the Labor Market
- At equilibrium, the quantity supplied and the quantity demanded are equal.
- In a situation of excess
- supply in the labor market, with many applicants for every job opening, employers will have an incentive to offer lower wages than they otherwise would have.
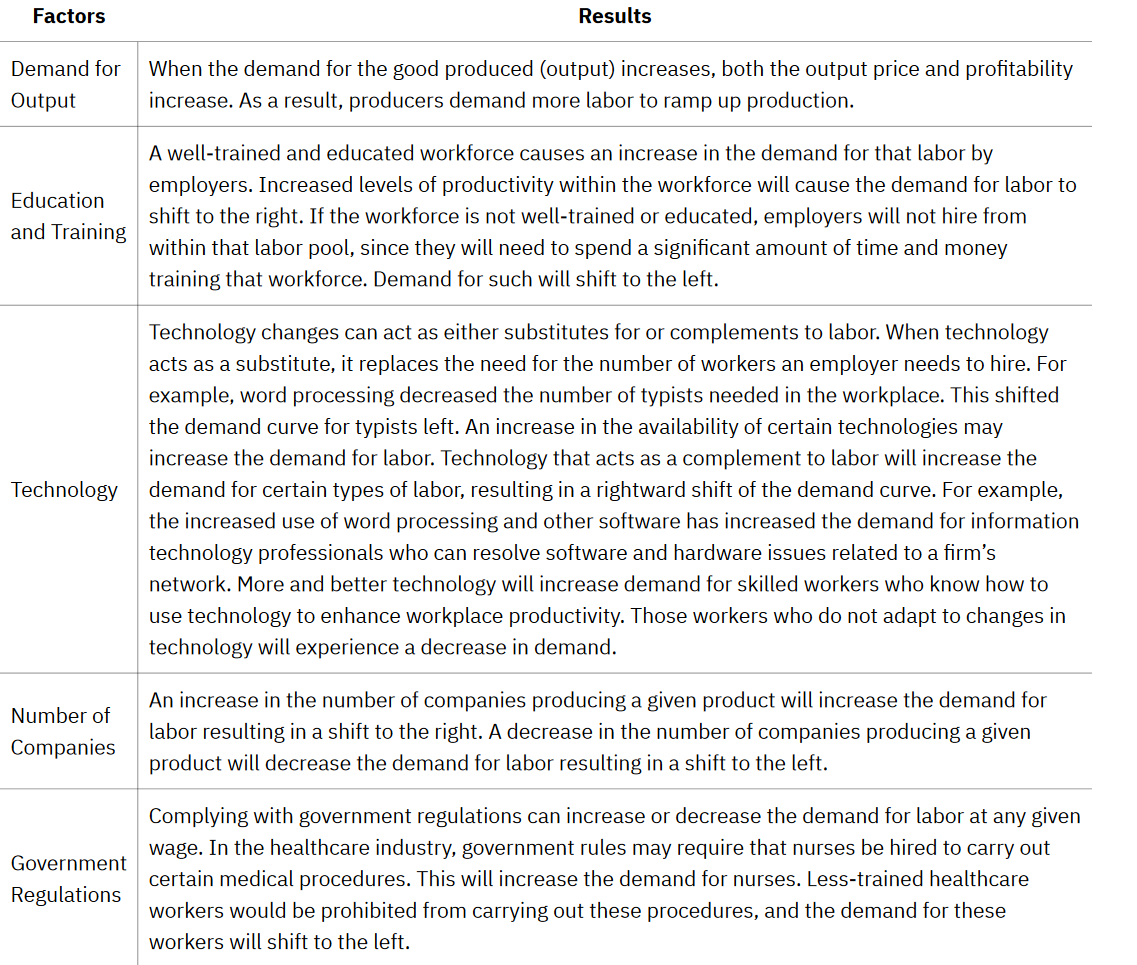
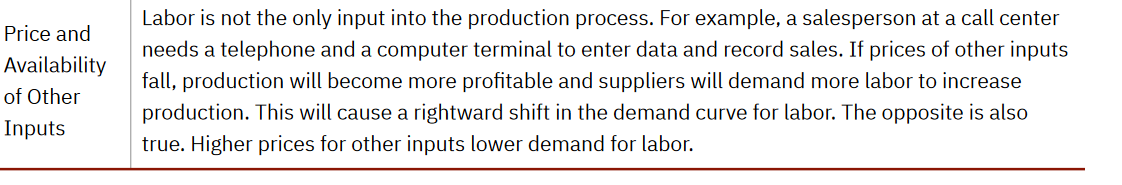
- Shifts in Labor Demand
- The demand for chefs is dependent on the demand for restaurant meals.
- The demand for pharmacists is dependent on the demand for prescription drugs.
- The demand for attorneys is dependent on the demand for legal services
- here (http://openstax.org/l/Futurework)
- Shifts in Labor Supply
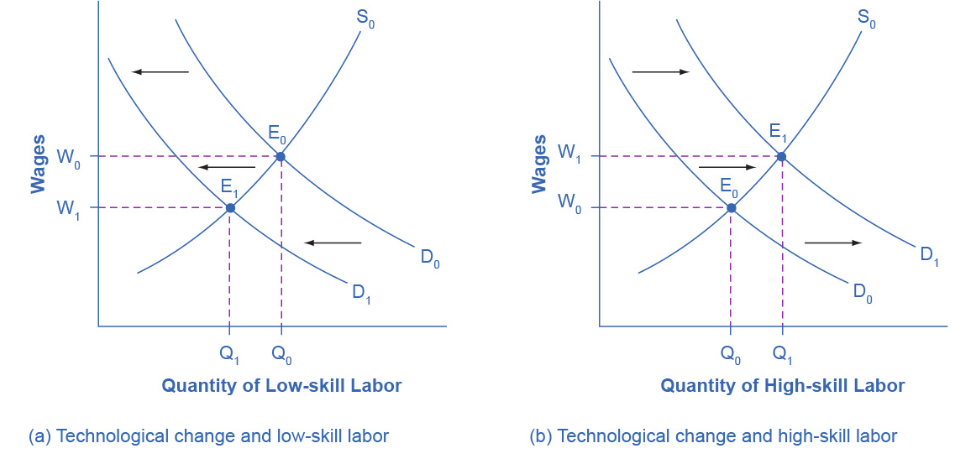
- Technology and Wage Inequality:
- The Four-Step Process
- website (http://openstax.org/l/oldtechjobs)
- The Four-Step Process
- Price Floors in the Labor Market:
- Living Wages and Minimum Wages
- The U.S. government sets a minimum wage, a price floor that makes it illegal for an employer to pay employees less than a certain hourly rate.
- Local political movements in a number of U.S. cities have pushed for a higher minimum wage, which they call a living wage.
- Living Wages and Minimum Wages
- The Minimum Wage as an Example of a Price Floor
- What’s the harm in raising the minimum wage?
- Equilibrium in the Labor Market
- Demand and Supply in Financial Markets
- In this section, we will determine how the demand and supply model links those who wish to supply financial capital (i.e., savings) with those who demand financial capital (i.e., borrowing).
- Who Demands and Who Supplies in Financial Markets?
- The simplest example of a rate of return is the interest rate.
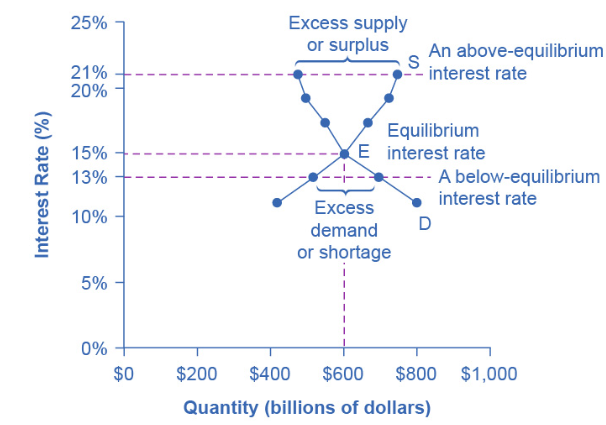
- According to the law of demand, a higher rate of return (that is, a higher price) will decrease the quantity demanded.
- Equilibrium in Financial Markets
- Website (https://openstax.org/l/FRED_stlouis).
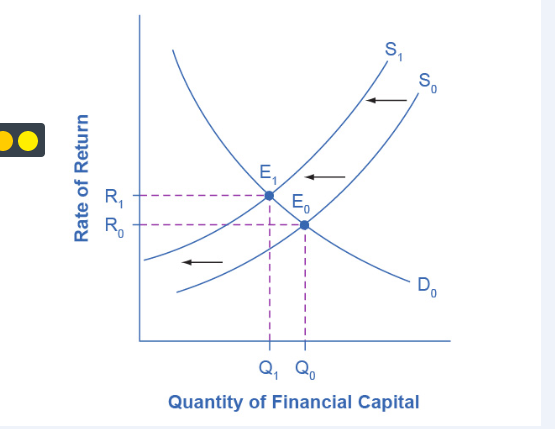
- Shifts in Demand and Supply in Financial Markets
- Economists call this intertemporal decision making because it involves decisions across time.
- The United States as a Global Borrower
- The Effect of Growing U.S. Debt
- Price Ceilings in Financial Markets:
- Usury Laws
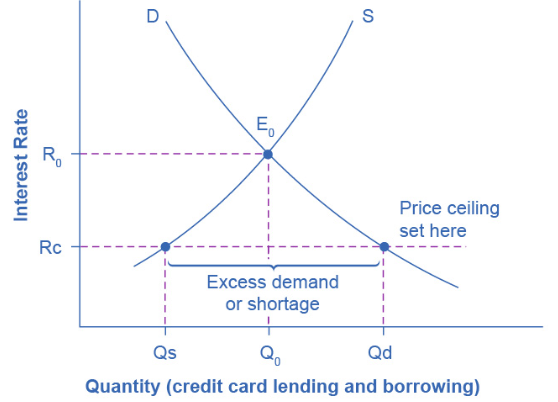
- Many states do have usury laws, which impose an upper limit on the interest rate that lenders can charge.
- Usury Laws
- The Market System as an Efficient Mechanism for Information
- Why are demand and supply curves important?
- Baby Boomers Come of Age
- Why are demand and supply curves important?
- Elasticity
- Introduction to Elasticity
- That Will Be How Much?
- Elasticity is an economics
- concept that measures responsiveness of one variable to changes in another variable.
- That Will Be How Much?
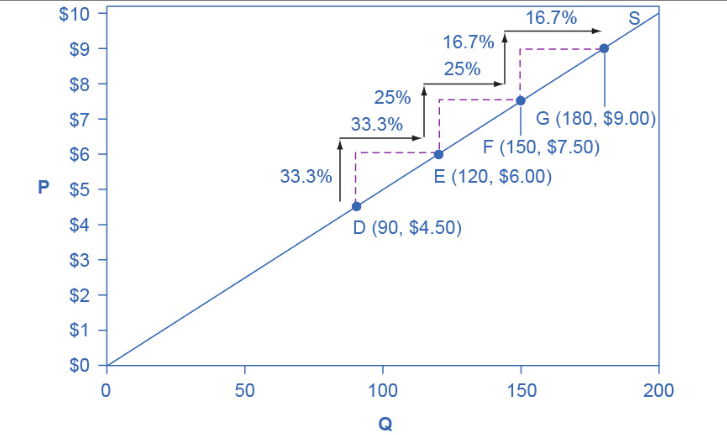
- Price Elasticity of Demand and Price Elasticity of Supply
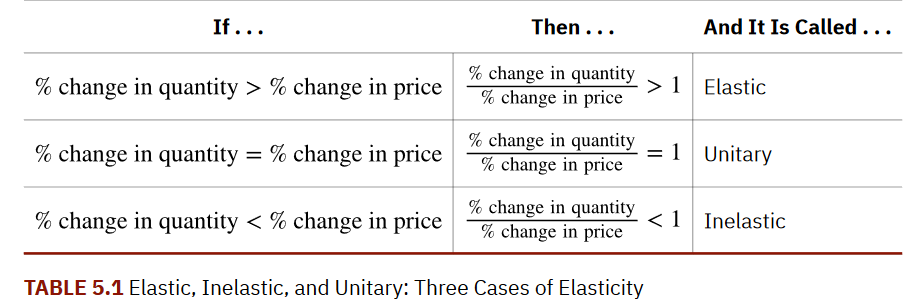
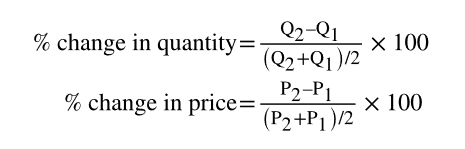
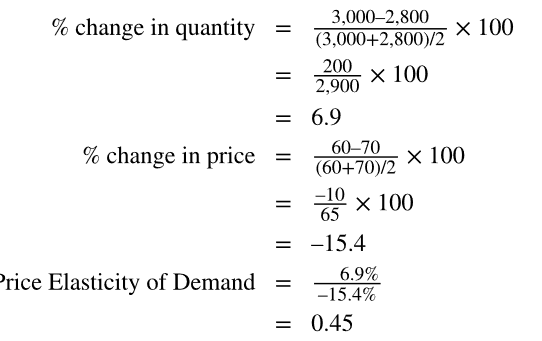
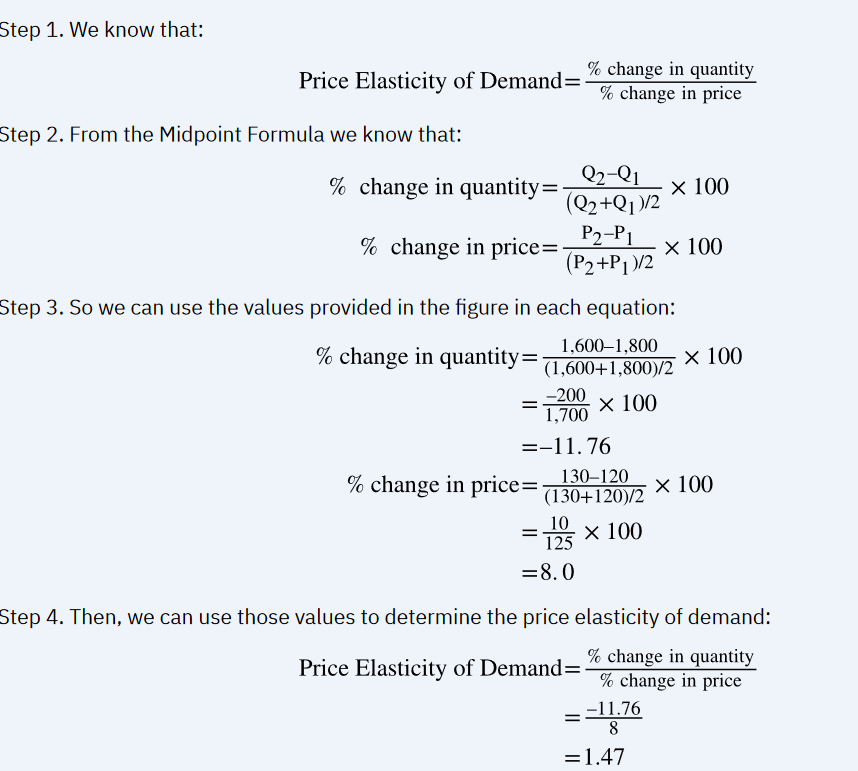
- Price elasticity is the ratio between the percentage change in the quantity demanded (Qd) or supplied (Qs) and the corresponding percent change in price. The price elasticity of demand is the percentage change in the quantity demanded of a good or service divided by the percentage change in the price. The price elasticity of supply is the percentage change in quantity supplied divided by the percentage change in price.
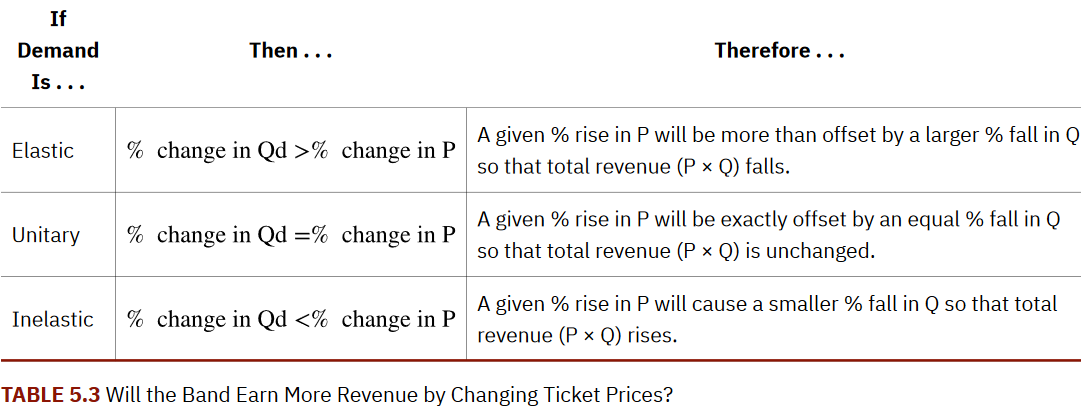
- An elastic demand or elastic supply is one in which the elasticity is greater than one, indicating a high responsiveness to changes in price. Elasticities that are less than one indicate low responsiveness to price changes and correspond to inelastic demand or inelastic supply. Unitary elasticities indicate proportional responsiveness of either demand or supply, as Table 5.1 summarizes.
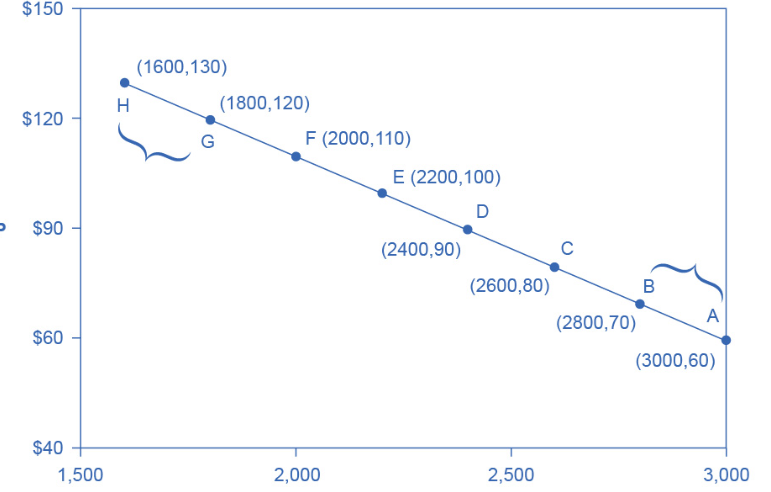
- Calculating Price Elasticity of Demand
- Finding the Price Elasticity of Demand
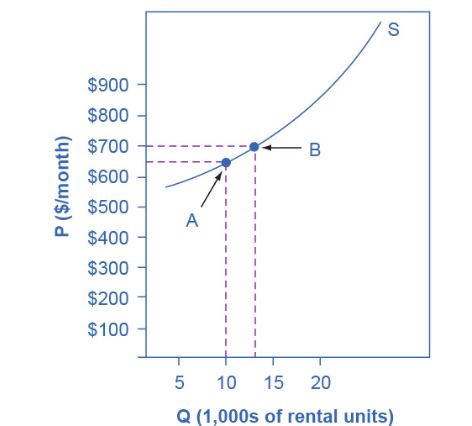
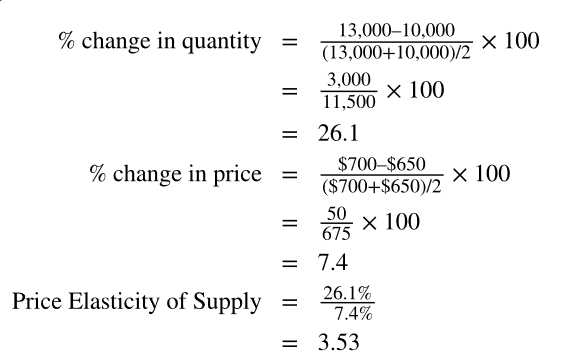
- Calculating the Price Elasticity of Supply
- Is the elasticity the slope?
- Polar Cases of Elasticity and Constant Elasticity
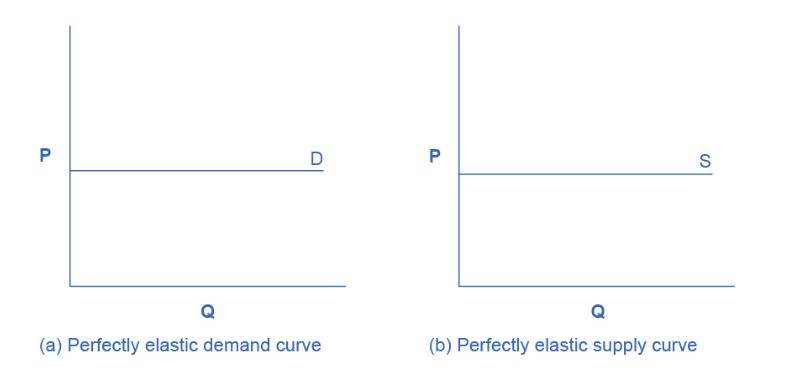
- Infinite elasticity or perfect elasticity refers to the extreme case where either the quantity demanded (Qd) or supplied (Qs) changes by an infinite amount in response to any change in price at all.
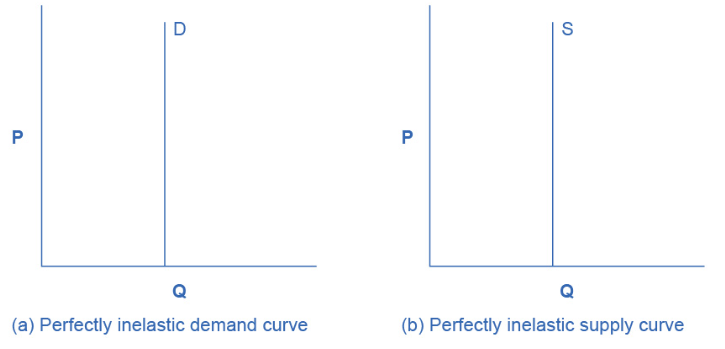
- Zero elasticity or perfect inelasticity, as Figure 5.5 depicts, refers to the extreme case in which a percentage change in price, no matter how large, results in zero change in quantity.
- Elasticity and Pricing
- article (http://openstax.org/l/Movietickets)
- Does Raising Price Bring in More Revenue?
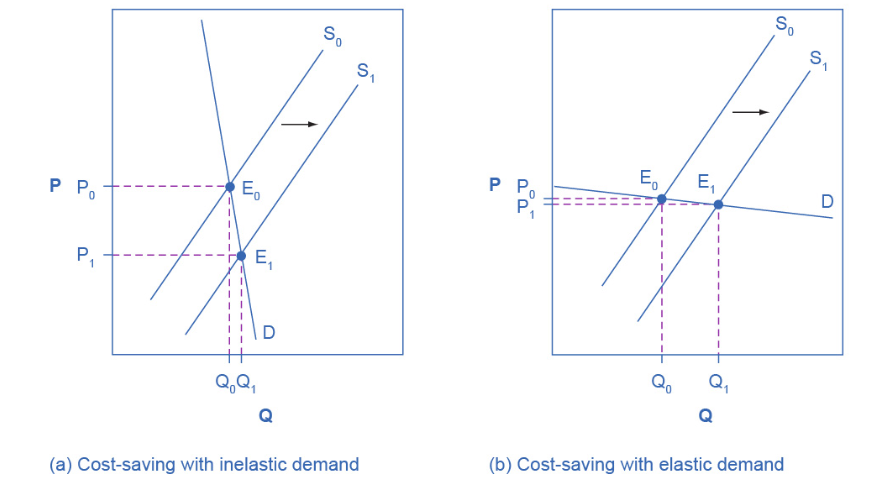
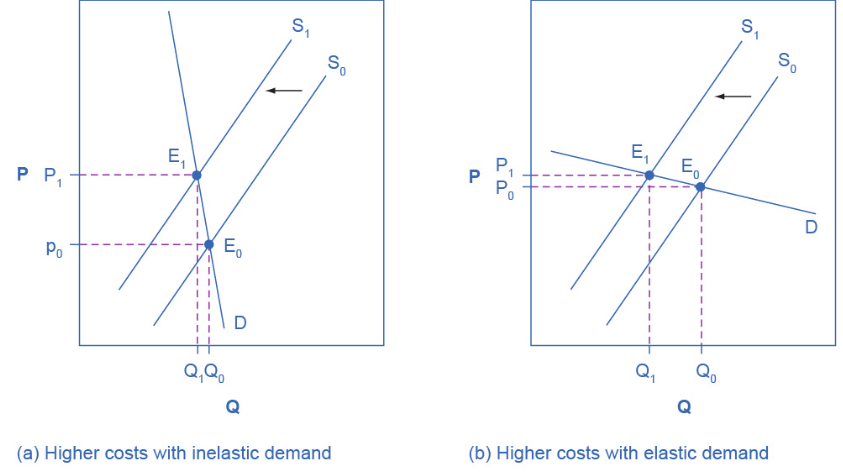
- Can Businesses Pass Costs on to Consumers?
- How do coffee prices fluctuate?
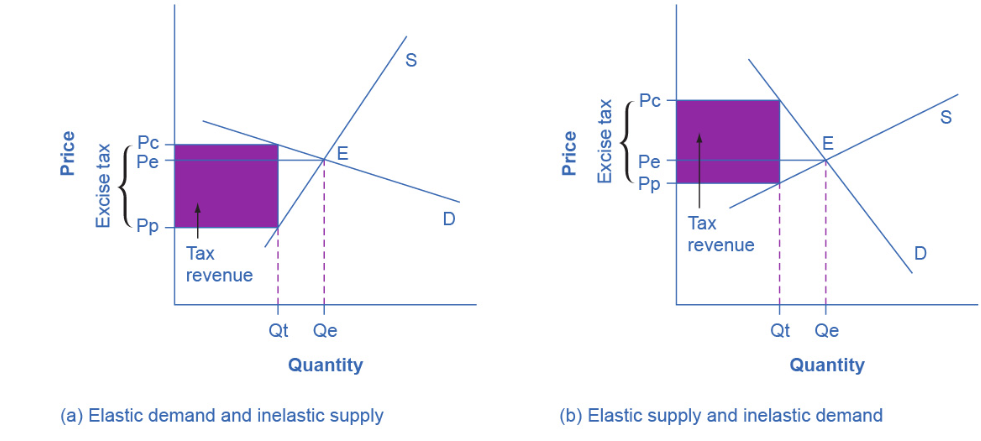
- Elasticity and Tax Incidence
- The analysis, or manner, of how a tax burden is divided between consumers and producers is called tax incidence.
- Long-Run vs. Short-Run Impact
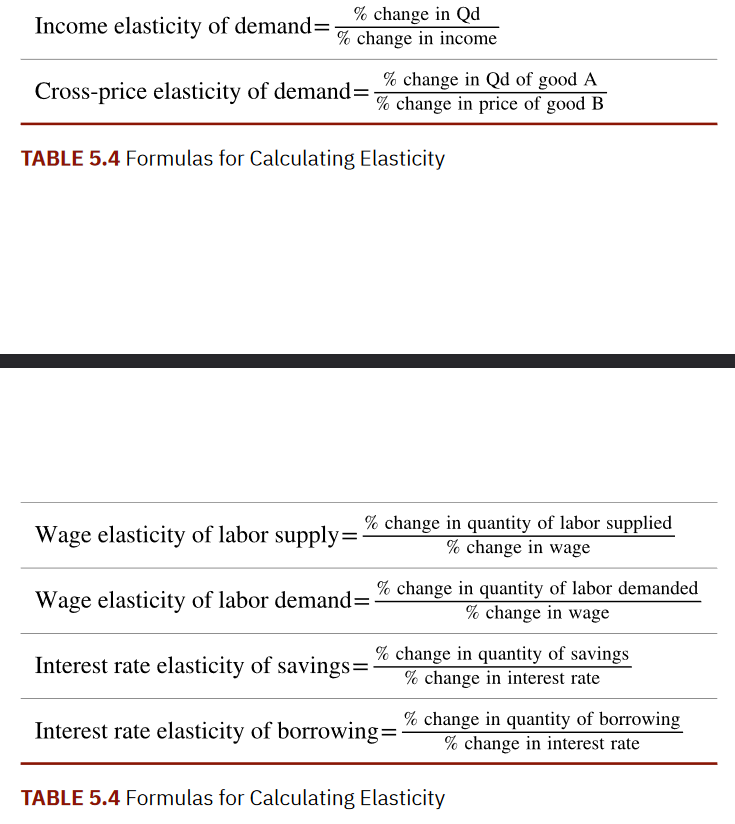
- Elasticity in Areas Other Than Price
- Income Elasticity of Demand
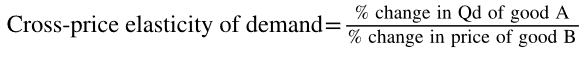
- Cross-Price Elasticity of Demand
- The cross-price elasticity of demand puts some meat on the bones of these ideas
- Elasticity in Labor and Financial Capital Markets
- In the labor market, for example, the wage elasticity of labor supply
- That is, the percentage change in hours worked divided by the percentage change in wages
- In the labor market, for example, the wage elasticity of labor supply
- Income Elasticity of Demand
- Introduction to Elasticity

Will reflect the shape of the labor supply curve.

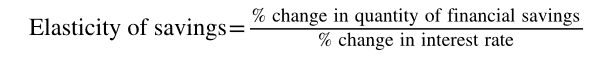
In markets for financial capital, the elasticity of savings
That is, the percentage change in the quantity of savings divided by the percentage change in interest rates
Will describe the shape of the supply curve for financial capital.
- Expanding the Concept of Elasticity
- That Will Be How Much?
- Expanding the Concept of Elasticity
⅓ of the globe had markets, private property, laws, and enterpreneurship. The other ⅔ of people lives in counties with at least one of the four things missing.
50 years later, the UN it was flipped.
Private Property must be:
- Definable
- Defendalbe
- Divestible
Contrast Microeconomics and Macroeconomics
- We can divide that ground into two parts:
- Microeconomics focuses on the actions of individual agents within the economy, like households, workers, and businesses. Macroeconomics looks at the economy as a whole. It focuses on broad issues such as growth of production, the number of unemployed people, the inflationary increase in prices, government deficits, and levels of exports and imports.
Microeconomics
Macroeconomics
- A nation's central bank conducts monetary policy, which involves policies that affect bank lending, interest rates, and financial capital markets.
- A nation's legislative body determines fiscal policy, which involves government spending and taxes.
Interpret a Circular Flow Diagram
- A good model to start with in economics is the circular flow diagram, as seen in Figure 1. It pictures the economy as consisting of two groups or sectors—households and firms—that interact in two markets:
- the goods and services market in which firms sell and households buy and the labor market in which households sell labor to business firms or other employees.
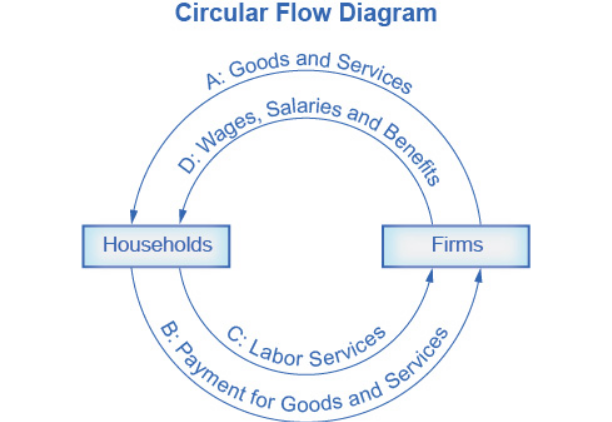
- Firms produce and sell goods and services to households in the market for goods and services (or product market). Arrow “A” indicates this.
- Households pay for goods and services, which becomes the revenues to firms. Arrow “B” indicates this.
- They provide the labor and other resources (e.g. land, capital, raw materials) firms need to produce goods and services in the market for inputs (or factors of production). Arrow “C” indicates this.
- In return, firms pay for the inputs (or resources) they use in the form of wages and other factor payments. The arrow “D” indicates this.
Calculate Opportunity Cost
Understanding Budget Constraints
Three macro goals:
- Econ growth up 3%
- Real GDP
- “Full” Employment 5% or less
- Unemployment rate
- Price stability 2%
- Inflation rate
Civilian workforce:
- Every able-bodied person sixteen and over
President can’t cut taxes
Efficiency
- Productive Effeciency
- Get to the curve
- Allocative Efffeciency
- What combo to get to the curve
Price up leads to low demand
Prise down leads to high demand
High price high splight
Low price low supply.
Ceteris paribus
Opportunity cost
Supply up, price down, quantity up
Demand up, price up, quantity down
Revenue = Price x Quantity
Revenue - Expense = Profit
Demand down, price down, quantity down
- One person’s spending becomes another person’s income.
- Idle hands are the Devil’s workshop
ND Gov is running for prez, but said seven lies in six minutes about oil when the state has oil-based econ
Federal Open Market Committee
Consumer Surplus
Producer Surplus
CS+PS=Total social welfare
Since 2022, the Fed has raised interest rates eleven times.
Biden doesn’t control inflation because just one person does not control it.
In Texas
Get rid of the last line in the instructions on Macro Unit Two CPI Practice
We’ve always had inflation
Biggest amount of inflation is in housing
Vensewal inflation was 398% last and 404% previously, but the US is at .6%
CPI: 100/1460=X/1846
GDP = C + I + G + NX = AD
A=Agregrate
C=Consumers (⅔ of econ)
I=Investment (A little of 15%)
G=Governement
NX=Exports - imports
D=Demand
18=12+3+4+NX
18=19+NX
NX=-1 trillion
GDP=Durable goods+Nondurable goods+Services+Structures+Change in inventories
Gov Econ Policies
- Monetary policy = controlling money supply
- Fiscal policy = Taxing and spending
- Regulatory policy = Rule of law
President can’t spend money, that’s congress
Fiscaldata.tresury.gov
It’s illegal for MN to overspend
One person’s spending becomes another person’s income
Supply up, price down, quantity down
Supply down, price up, quantity dow
Demand up, price up, quantity up
Demand down, price down, quantity down
R-E=P
R=Pirce x quantity
Intrest rates are the highest since 2000
MPC=change in c /change in I = 75/100 = .75
MPC+MPS=1
.75+MPS=1
MPS=.25
1/.25=4
CPI
Aggregate demand
MPC+MPC=1
US #1 in importing
#2 exporting
Per capita #58 Exporting
#69 Imports
We gave China dicator standing obation
The Magic of the Multiplier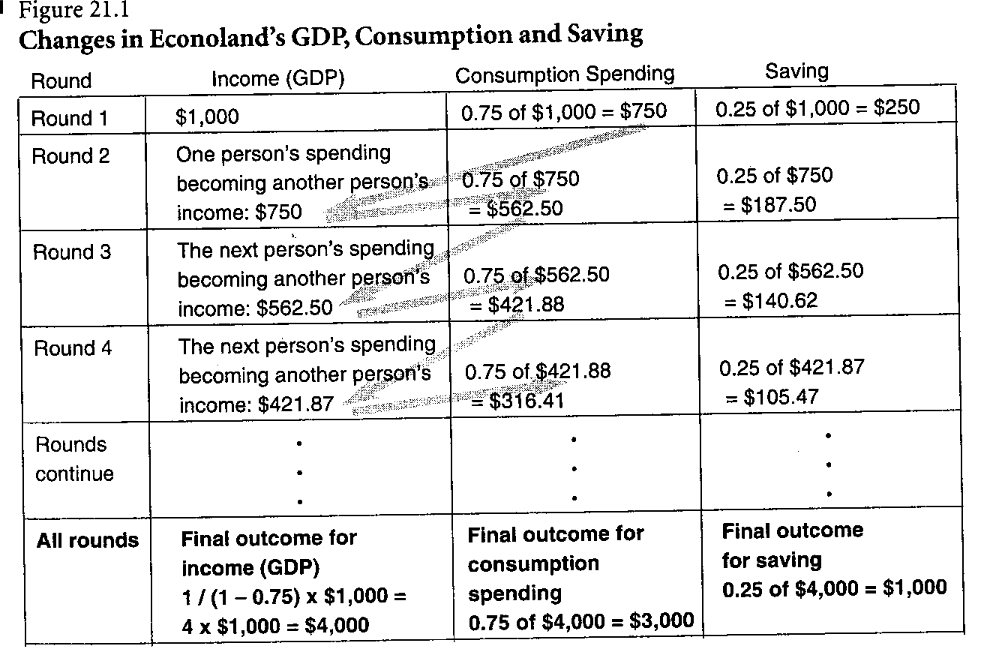
Inflation: General rise in relative prices
Too many dollars chasing too few goods
GDP = C+I+G+NX=AD
Orphans don’t have a lot of money
Save 15%
Monetary policy = Controling money supply
Fiscal policy = Taxing and spending
Regulatory policy
1620 * 52 * 40 = $3,369,600
905 * 52 * 40 = $1,882,400
Rule of 72
72/2.5
28.8 years
Regulations are reactionary
ADP NER is a monthly report of econ data that tracks nonfarm private employees in the US
ADP ER was launched in 2006
ADP Inc, the company that issues the report, handles payroll for about one-fifth of all privately-employed ind in the US
ADP NER is viewed as a helpful preview to a more detailed BLS employment situation report
ADP NER is divided into separate releases.
Hawkish hold
- Not doing anything
Grand Meadow Bank good
Companies are interest sensitive
December 2017
March 2020
- Fiscal policy
- Tax law
- Rev down
- Expenses up
- Tax law
- Covid
- Rev down
- Expenses up
- Too many dollars choosing too few goods
- Monetary policy
- Up money supply
#2 reason for divorce is finances
#3 reason for suicide is finances
Less people have full pentions
$1/19.57= x/500
500/19.57=19.57x/19.57
$25.54
1/18.31=x/500
500/18.31 = $27.31
Deprecated
Only reason there is poverty is no sharing
The Macro Econ Market
AD up
AD down
AS UP
AS down