Lecture 9 – The Electrocardiogram
The Physical Principles of Electrocardiography
an ECG is a non-invasive technique that records the sum of all cardiac electrical activity from the body surface
Dipole Concept in a Volume Conductor
the body tissues acts as a volume conductor because they contain ions that can carry electrical current
at any instant, the electrical activity of the heart can be represented as a single dipole
a dipole is a pair of equal but opposite charges ( + and - ) separated by a small distance
the dipole represents the wavefront of depolarisation. the -ve end is the resting tissue, and the +ve end is the depolarised tissue. the arrow points form negative to positive (direction of wavefront movement)
What Determines the Measured Voltage on an ECG
the voltage recorded by any two electrodes depends on three factors:
vector — the dipole is represented as a vector (an arrow)
direction of the vector: direction of the dipole
length of the vector: strength (voltage) of the dipole
projection — an ECG lead records a projection of the cardiac vector onto its specific lead line
rule for a positive deflection: a positive deflection is recorded when the positive end of the dipole is facing the positive electrode of the lead
rule for a negative deflection: a negative deflection is recorded when the positive end of the dipole is facing the negative electrode of the lead
Key Principle: the ECG doesn’t directly ‘see’ the AP of a single cell. Instead, it sees the net, instantaneous vector sum of all the electrical activity occurring in the heart at that moment, projected onto the different lead axes
ECG Waveforms and Cardiac Cycle
the standard ECG trace is a voltage vs. time recording with three main deflections: the P wave, QRS complex, and T wave

**Important Relationship: the ECG doesn’t directly show contraction or relaxation. It shows the electrical activation that causes contraction. Mechanical systole occurs shortly after the QRS, and diastole occurs after the T wave
ECG Recording Process
a standard clinical 12-lead ECG records the heart’s electrical activity from 12 different perspectives (leads). there are 10 physical electrodes placed on the body
lead systems
leads aren’t just ‘wires’; each lead is a specific view or projection of the cardiac vector

Einthoven’s Triangle and the Hexaxial System
Einthoven’s Triangle
an equilateral triangle formed by the three limb leads with the heart at the centre
Hexaxial System
the six frontal plane leads arranged every 30° around the heart.
this allows calculation of the mean QRS axis
The 12-Lead ECG Layout
a standard 12-lead ECG includes:
→ 6 frontal plane leads: I, II, III, aVR, aVL, aVF
→ 6 horizontal plane leads: V1 – V6
→ 1 rhythm strip: often a long recording of lead II to assess rhythm continuously
Detecting ECG Abnormalities
by analysing the shape, size, and timing of the deflections, many abnormalities can be detected
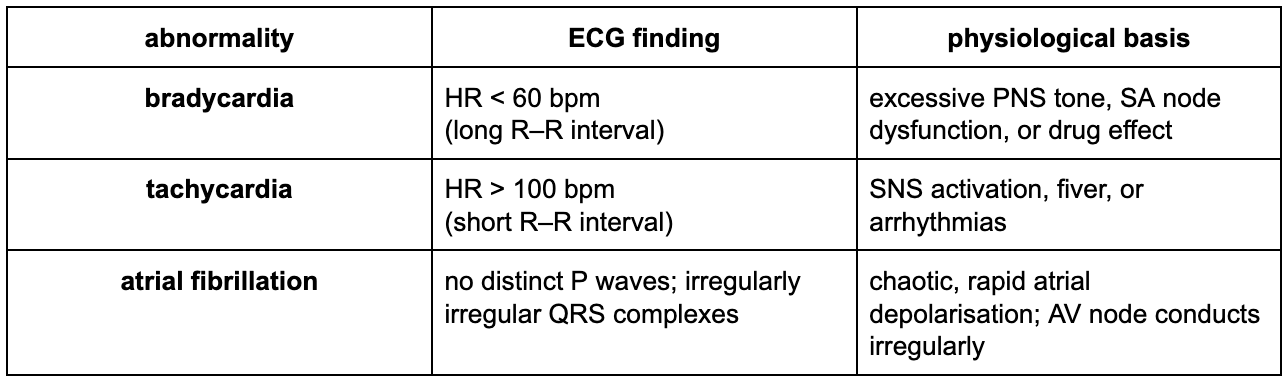
abnormalities in rate and rhythm
abnormalities in conduction

abnormalities related to ischemia and infarction
myocardial ischemia/infarction alters the normal sequence of repolarisation and depolarisation, causing characteristic changes

calculating the mean QRS axis
the mean QRS axis is the average direction of ventricular depolarisation in the frontal plane
it’s normally between -30° and +110°