day 5 part 6 Economics: Competitive Equilibrium and Market Dynamics
Market Equilibrium in the Competitive Oil Market
The Concept of Intersection: Market equilibrium occurs at the intersection of the market demand curve and the market supply curve. This intersection point identifies the unique price and quantity at which the plans of buyers and sellers are in total agreement.
Competitive Equilibrium: In a competitive market, this intersection is specifically referred to as the competitive equilibrium.
Defining "Competitive" in Economics: A market is considered competitive when there is a sufficiently large number of buyers and sellers such that no individual actor can influence the market price. Competition Dynamics: Contrary to the standard narrative of "buyer versus seller," competition in a competitive market actually refers to: Buyers vs. Buyers: Buyers are in competition with other buyers to acquire the goods. Sellers vs. Sellers: Sellers are in competition with other sellers to provide the goods.
Understanding Disequilibrium: Surplus and Shortage
Excess Supply (Surplus): This occurs when the market price is set above the competitive equilibrium price. Result: A surplus/excess supply where Q_S > Q_D. Consequences and Market Reaction: Sellers observe inventory piling up (e.g., tankers full of oil docked at shores, unable to unload). To clear this inventory, sellers compete with each other by bidding prices down. As the price falls, the quantity demanded increases along the demand curve until equilibrium is restored.
Excess Demand (Shortage): This occurs when the market price is set below the competitive equilibrium price. Mechanism: At a price lower than equilibrium, buyers want to purchase more than suppliers are willing to sell at that price (Q_D > Q_S). Consequences and Market Reaction: Buyers, competing against other buyers, start a "bidding war" by offering higher prices to secure the limited supply. As prices rise, suppliers increase their quantity supplied until the market returns to the equilibrium point.
Market Dynamics and Convergence
The Persistence of Disequilibrium: In the absence of government regulation or price restrictions (e.g., price floors or ceilings), a surplus or shortage cannot persist. Market forces naturally drive the price toward the equilibrium level.
The Highway Lane Metaphor: Market equilibrium is analogous to traffic lanes. If one lane is moving significantly slower than others, drivers will move out of it and into faster lanes until, on average, all lanes move at approximately the same speed. Similarly, buyers and sellers adjust their behavior until the market clears.
Case Study: The Economics of Brown vs. White Eggs
The Research Question: Why are brown eggs more expensive than white eggs?
Hypothesis 1 (Demand-side Story): There is a higher demand for brown eggs. * Rationales: People perceive brown eggs as tastier, healthier, organic, or cage-free, making them willing to pay a premium.
Hypothesis 2 (Supply-side Story): There is a lower supply of brown eggs due to higher production costs. Rationales: Brown eggs are more expensive to produce due to factors like chicken breeds, specific feed requirements (organic/cage-free), or other determinants of supply.
Empirical Testing of Hypothesis 1: Higher Demand
The Controlled Model: To test the demand hypothesis, we "shut off" the supply channel by assuming the cost of production is identical for both egg types. Assumption: Supply of brown eggs () equals the supply of white eggs ().
Graphical Prediction: Shift the demand curve for brown eggs () to the right (higher) relative to the demand for white eggs (). Results of the Model: This predicts a higher equilibrium price (P_b > P_w) and a higher equilibrium quantity (Q_b > Q_w).
Empirical Conflict: While the price prediction (P_b > P_w) matches reality, the quantity prediction (Q_b > Q_w) does not. In grocery stores, we typically see much fewer brown eggs sold than white eggs. Therefore, Hypothesis 1 is rejected.
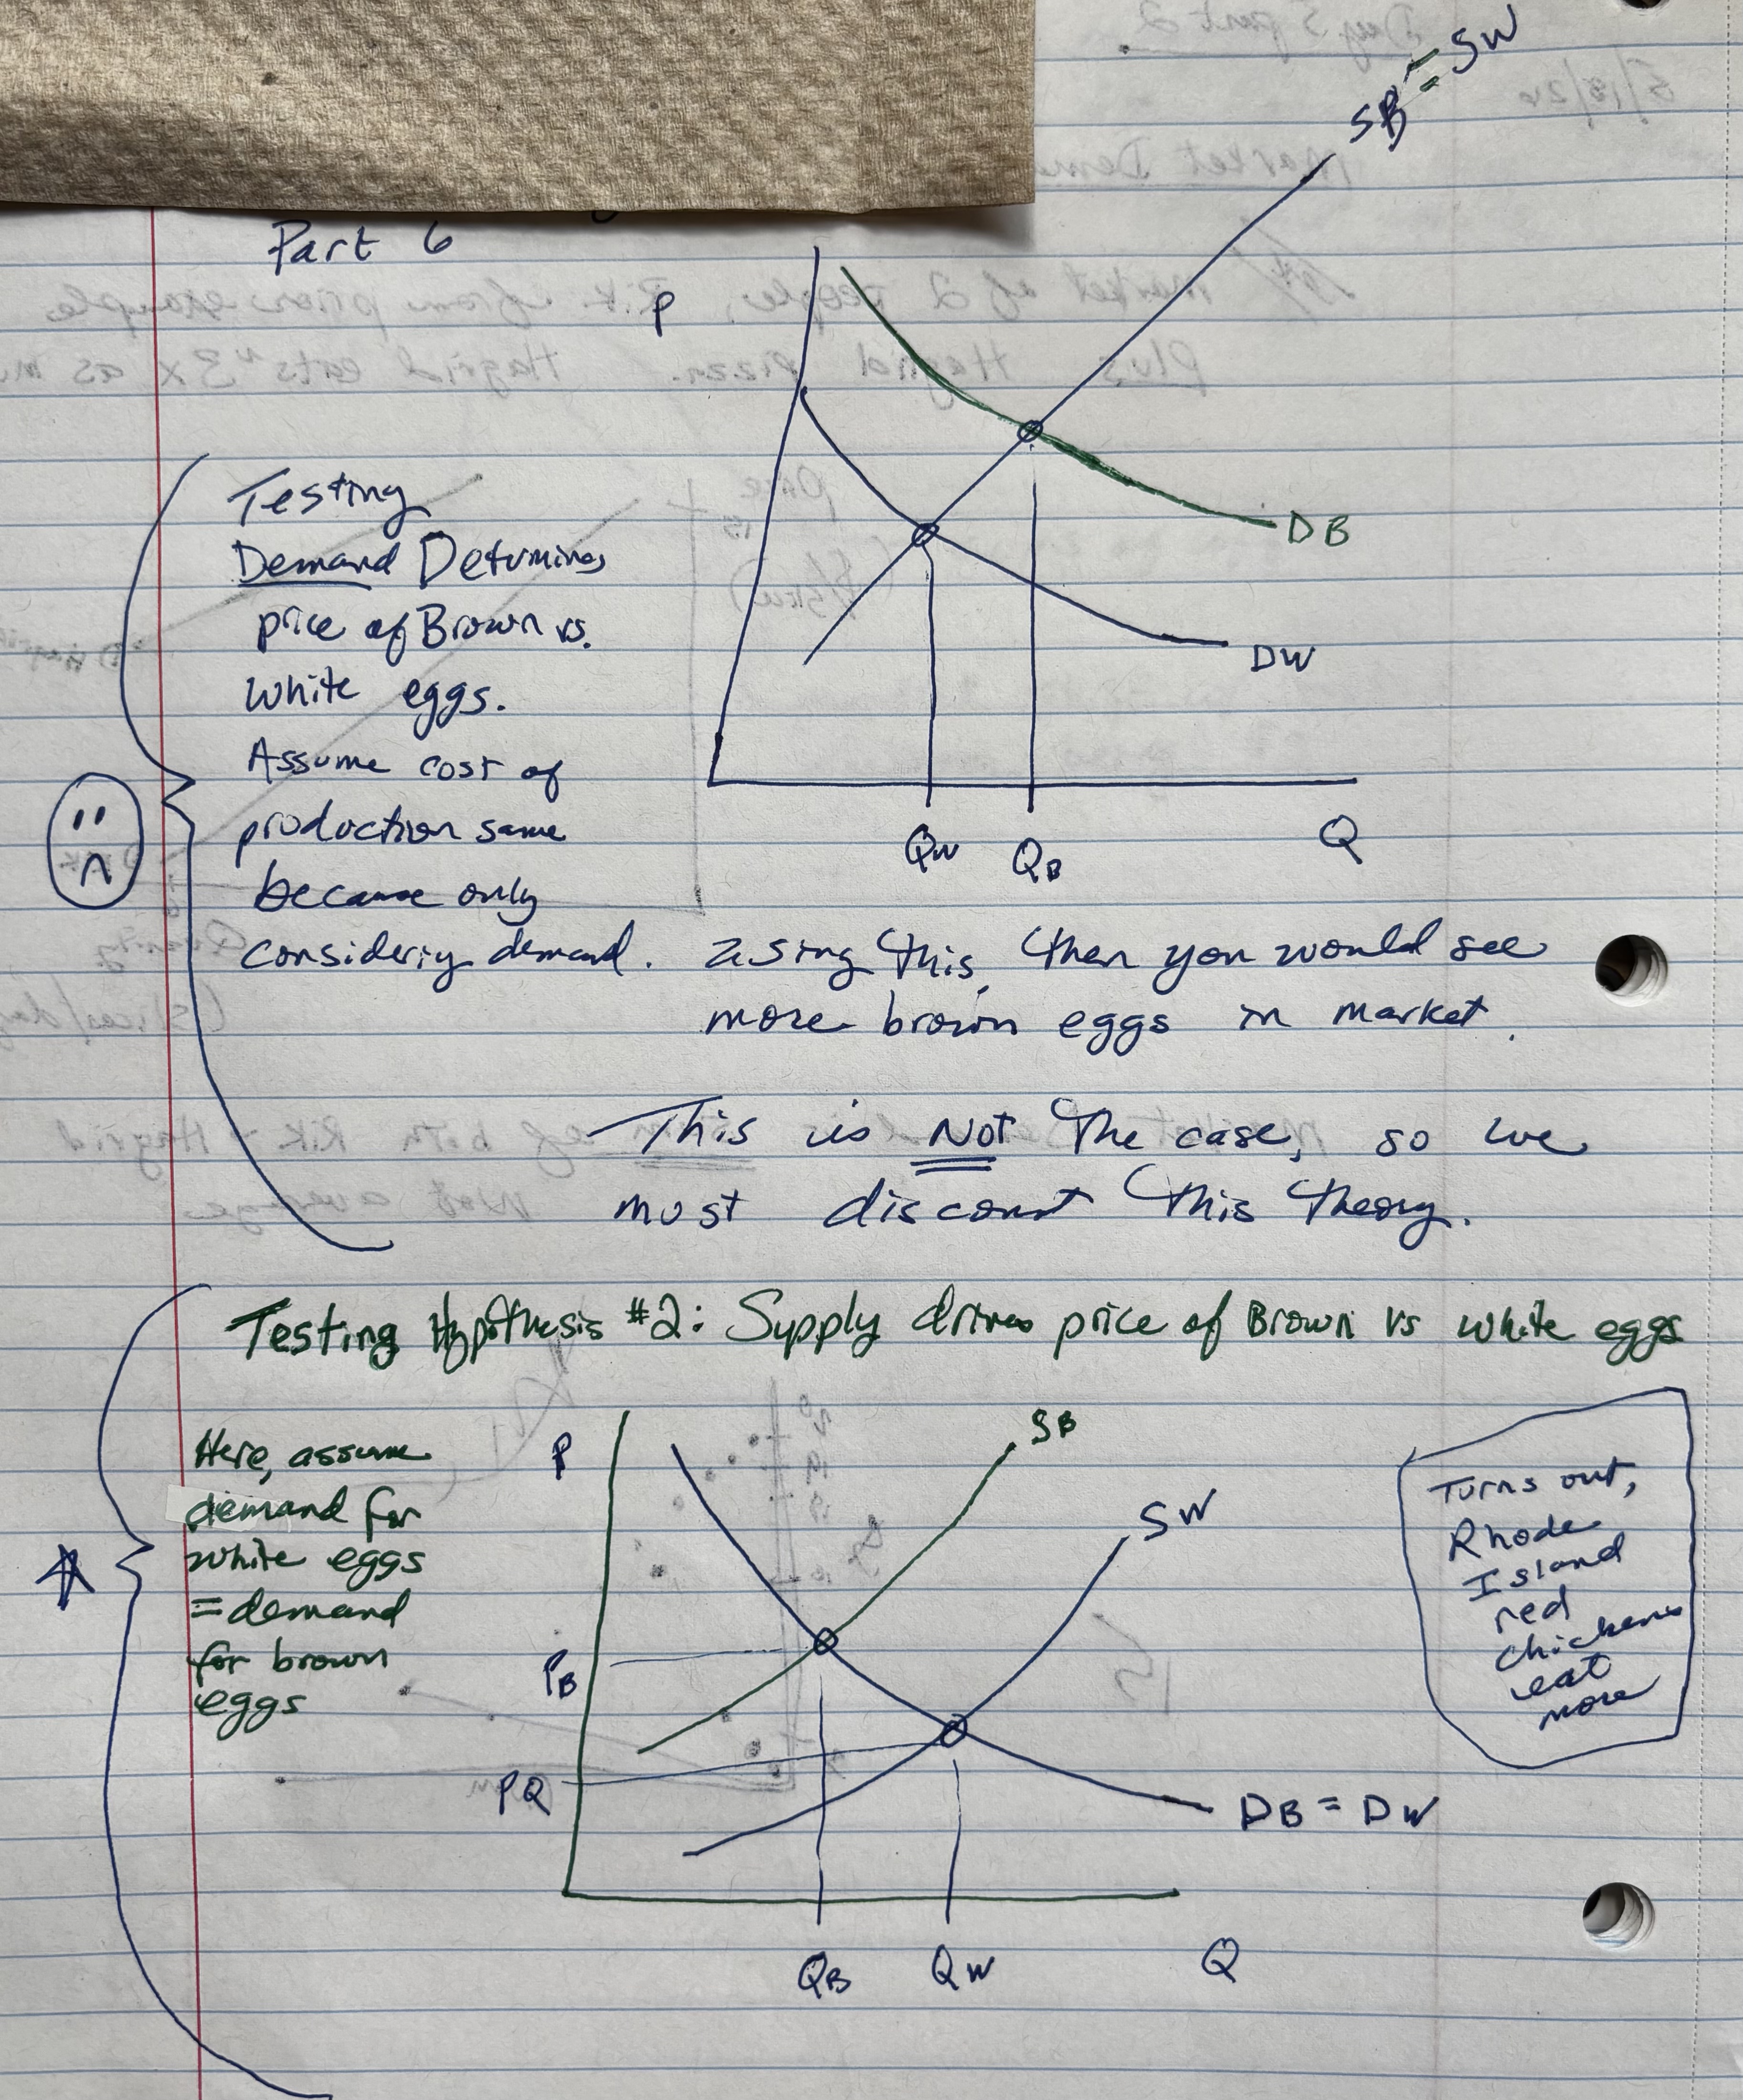
Empirical Testing of Hypothesis 2: Lower Supply
The Controlled Model: To test the supply hypothesis, we "shut off" the demand channel to isolate the supply effects. Assumption: Demand for brown eggs () equals the demand for white eggs ().
Graphical Prediction: A "lower supply" is represented as a leftward shift along the quantity axis (effectively higher on the vertical axis). Results of the Model: This predicts a higher equilibrium price (P_b > P_w) and a lower equilibrium quantity (Q_b < Q_w).
Empirical Alignment: This matches real-world observations: brown eggs are more expensive and sold in lower quantities than white eggs. Therefore, Hypothesis 2 cannot be rejected and is the likely driver of the price difference.
Final Conclusion and The Rhode Island Red Chicken
The Determinant of Supply: The fundamental reason for the price difference is the chicken breed. Brown eggs are produced by the Rhode Island Red chicken.
Cost Efficiency Factors: Size and Feed: Rhode Island Red chickens are larger than the chickens that lay white eggs and require more feed per egg produced. Space Requirements: Because they are larger, they require more physical space, meaning fewer chickens can be housed on the same acreage.
Economics as a Tool for Thinking: This analysis demonstrates the power of the economic way of thinking. By using simple supply and demand curves and walking through the logic of equilibrium, one can deduce the cause of a real-world phenomenon without needing external research or articles. The goal of the course is to teach "how to think," not "what to think."