Basic Concepts, Definitions, Sampling Techniques and Probabilities
Basic Concepts and Definitions
A data set is a collection of data values. Each value in the data set is called a data value or a ==datum==.
- Data are facts, figures and information collected on some characteristics of a population or sample
- These can be classified as qualitative or quantitative data
- Population or Universe refers to the totality of objects, persons, places, things used in a particular study.
- Sample is any subset of population or few members of a population.
- The person who plans and conducts the statistical investigation independently or with the help of others is called investigator.
- The person who answers/responds to the set of questions is called respondent.
- The person who collects data by conducting an enquiry or an investigation is called enumerator. Often the enumerator is a trained person for field work.
- ==Categorical data== is also called qualitative data while ==numerical data== is also called quantitative data.
- ==Categorical== ==data== is a ^^type of data that is used to group information with similar characteristics^^.
- ==Numerical data== is a ^^type of data that expresses information in the form of numbers^^.
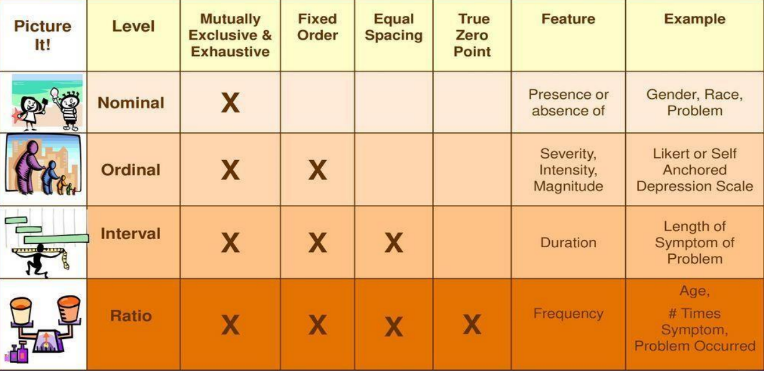
Levels of Measurement in Statistics
- Nominal Scale
- classifies data into mutually exclusive (non-overlapping), exhausting categories in which no order or ranking can be imposed on the data.
- Ordinal Scale
- classifies data into categories that can be ranked; however, precise differences between the ranks do not exist.
- Interval Scale
- ranks data, and precise differences between units of measure do exist; however, there is no meaningful zero.
- Rational Scale
- possesses all the characteristics of an interval measurement, and there exist a true zero.
Data Sources
Primary data
- is collected ^^firsthand^^ by a researcher (organization, person, authority, agency or party etc) through experiments, surveys, questionnaires, focus groups, conducting interviews and taking (required) measurements.
Secondary data
- Secondary data is ^^readily available^^ (collected by someone else) and is available to the public through publications, journals and newspapers.
Variable
- is a measure or characteristic or property of a population or sample that may have a number of different values. It differentiates a particular member from the rest of the group. It is the characteristic or property that is measured, controlled, or manipulated in research.
Constant
- is a characteristic or property of a population or sample which is common to all members of the group.
The three basic methods of collecting data:
- Retrospective
- cohort studies are a type of observational research in which the investigator looks back in time at archived or self-report data.
- Observational studies
- process or population is observed and disturbed as little as possible, and the quantities of interests are recorded.
- Design of experiments
- is defined as a ^^branch of applied statistics^^ that deals with planning, conducting, analyzing, and interpreting controlled tests to evaluate the factors that control the value of a parameter or group of parameters.
Descriptive Statistics
- Collection
- Organization
- Summarization
- analysis
- presentation
- interpretation of data
Inferential Statistics
- generalizing from samples to population
- performing estimations
- hypothesis testing
- determining relationships among variables
- and making predictions.
Sampling Techniques
The process of selecting just a small group of cases from out of a large group is called ==sampling==.
WHY THERE IS A NEED TO SAMPLE?
Sampling- a valid alternative to a census when;
✓ A survey of the entire population is impracticable
✓ Budget constraints restrict data collection
✓ Time constraints restrict data collection
✓ Results from data collection are needed quickly
HOW TO COMPUTE FOR THE SAMPLE SIZE
Slovin’s Formula
- is used to calculate the sample size (n) given the population size (N) and a margin of error (e). It's a random sampling technique formula to estimate sampling size
- It is computed as n = N / (1+Ne^2).
- whereas: n = no. of samples N = total population e = error margin / margin of error
How to use Slovin's formula?
In research methodology, for example N=1000 and e=0.05
n =1000 / (1 +1000 *0.05²) n =285.7143 =286 samples
Andrew fisher formula
- Determine the population size (if known)
- Determine the confidence interval
- Determine the confidence level
- Determine the standard deviation (a standard deviation of 0.5 is a safe choice where the figure is unknown)
- Convert the confidence level into a Z-score, This table shows the z-scores for the most common confidence levels:
- Put these figures into the sample size formula to get your sample size.

Example:
Here is an example calculation:
Say you choose to work with a 95% confidence level, a standard deviation of 0.5, and a confidence interval (margin of error) of ±5%, you just need to substitute the values in the formula":
==Sample Size==
= ((1.96)^2(.5)(1-0.5))/(0.5)^2
= .9604/.0025
= 384.16
==Confidence level to Z-score==
95% z-score= (1+CL)/2
= (1 + 0.95)/2
= 0.975 \n 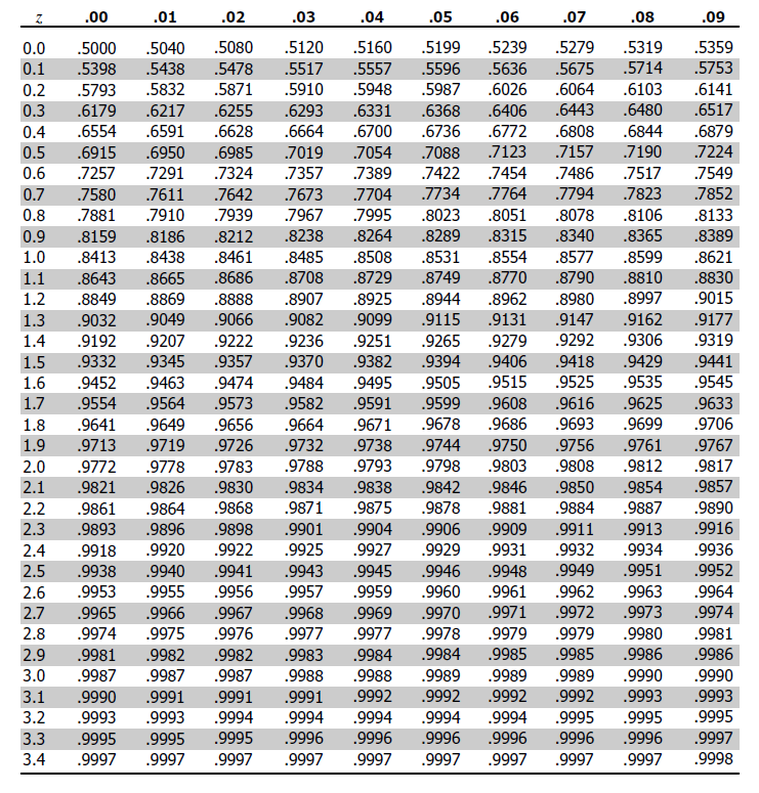
Probabilistic Sampling
In every element of our sample the probability of them has the same weight. EPS (Equal Probability of Sampling).
Stratified Sampling
is a method of sampling that involves the division of a population into smaller sub-groups known as ==strata==. Based on members’ shared ^^attributes or characteristic^^s such as income or educational attainment.
Random Sampling
is a subset of a statistical population in which ^^each member of the subset has an equal probability of being chosen.^^ A simple random sample is meant to be an unbiased representation of a group.
- The word ==random== refers to a process that generates a mathematically random result, one in which no humanly generated pattern exists.
Systematic Sampling
is a type of probability sampling method in which sample members from a larger population are selected according to a ^^random starting point but with a fixed, periodic interval.^^
Kth number =N/n
K=30 / 10 K=3
Say, starting with the 2nd person,
1st:Person #2 2nd:2 +3 =5; Person #5 3rd: 5 +3 =8; Person #8
Until 10 samples are completed
Cluster Sampling
is a probability sampling technique where researchers ^^divide the population into multiple groups^^ (clusters) for research. Researchers then select random groups with a simple random or systematic random sampling technique for data collection and data analysis.
Non-Probabilistic Sampling
is also called judgment or subjective sampling. This method is convenient and economical but the inferences made based on the findings are not so reliable.
Convenience Sampling
taken from a group of people easy to contact or to reach. For a example, standing at a mall or a grocery store and asking people to answer questions.
Purposive Sampling
also known as judgmental, selective, or subjective sampling, is a form of non-probability sampling in which researchers rely on their own judgement when choosing members of the population to participate in their surveys.
Quota Sampling
is a sampling methodology wherein data is collected from a homogenous group.
You continue sampling for each cell until you get the desired number and then stop.
- Types:
- proportional quota sampling - the major characteristics of the population by sampling a proportional amount of each is represented.
- non-proportional quota sampling - a bit less restrictive. In this method, a minimum number of sampled units in each category is specified and not concerned with having numbers that match the proportions in the population.
Snowball Sampling
is a recruitment technique in which research participants are asked to assist researchers in identifying other potential subjects.
Probability
Probability is the likelihood or chance of an event occurring
Probability = (tℎe number of ways acℎieving success)/(tℎe total number of possible outcomes)
Experiment – is used to describe any process that generates a set of data
Event – consists of a set of possible outcomes of a probability experiment. Can be one outcome (simple event) or more than one outcome (compound event).
Sample Space and Relationships among Events
- Sample space is the set of all possible outcomes or results of a random experiment. [S]
- Each outcome in the sample space is called an element of that set. [E]
- An event is the subset of this sample space.
S = {}
E = {}
P = ()
Operation with Events
Intersection of Events
For example:
S = {1,2,3,4,5,6}
Let A = {1,2,3,4} and B = {3,4,5};
then A ∩ B = {,3,4}
P(A ∩ B) = 2/6 = 33%
Union of Events
For Example:
S = {1,2,3,4,5,6}
Let A = {1,2,3,4} and B = {3,4,5};
then A ∪ B = {1,2,3,4,5}
P(A ∪ B) = 5/6 = 83%
Compliment of Event
For example:
S = {1,2,3,4,5,6}
Let A = {1,2,3,4}
P(A’) = not A
P(A’) = {5,6} = 2/6 = 33%
Mutually Exclusive Events
S = {1,2,3,4,5,6}
A = {1,2,3}
B = {5,6}
C = {3,4,5}
P(A∩B) = 0
Formula:
P(A ∪ B) = P(A) + P(B) - P(P ∩ B) Not MEE
P(A ∪ B) = P(A) + P(B) MEE
Example:
Of 120 Engineers surveyed, 60 are working in academe, 50 are working in the industry, 20 are working both in academe and industry. If an engineer is chosen at random, find the probability that the engineer is working either in academe or industry. Illustrate in a Venn Diagram
P(A ∪ B) = P(A) + P(B) - P(P ∩ B)
P(A ∪ B) = 60/120 + 50/120 - 20/120
P(A ∪ B) = 3/4 = 75%