Hypothesis Testing and One-Sample T-Test
Principles of Hypothesis Testing
Hypothesis testing is using statistical tests to find the probability of an event or result occurring purely by chance
we assess the probability to get the observed results, to combat random sampling error
are the results common or a rare occurrence
the p-value is the probability of the occurrence
is compared to the significance level alpha (Greek a)
If p-value < a, the result is rare
aka the pattern is highly unlikely when the probability is smaller than the chosen alpha level
for social science, that level is.05, so p must be less than .05 (p<.05)
sometimes we go with p < .01
otherwise, we fail to reject H0 and research hypothesis is not supported
Common Statistical Tests
Differences

Notice how for the paired sample t-test, there is not exactly an IV and DV, but one sample or measure is the IV and the other is the DV
do the forms of variables matter?
e.g. IV being nominal and the DV being mostly interval or ratio in the table. W
Relations Between Variables

For linear relationships, both variables can be interval or ratio
For linear relationships with more than one IV, IV can be interval and ratio, or dummy-coded nominal or ordinal, and DV is interval or ratio
Type 1 and Type II Errors
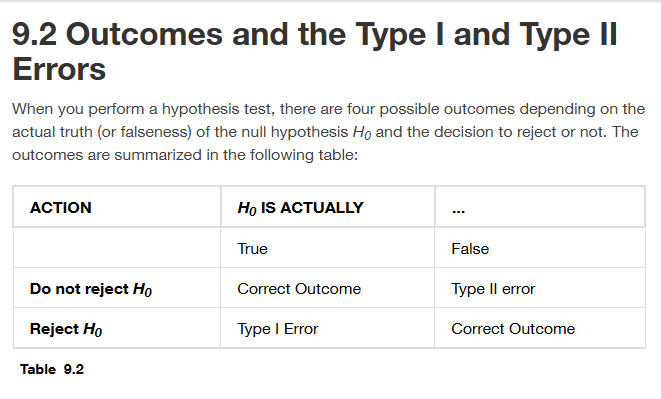
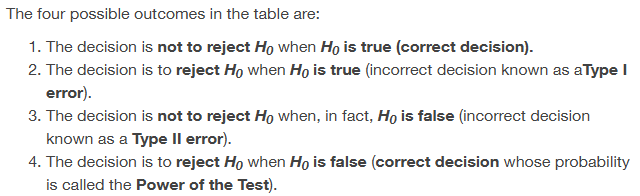
Type I (false positive) (also symbolized by alpha)
Is when you reject the null but you shouldn’t have bc there was no difference or relation
You’re saying something existed when it actually didn’t
we want to make the probability of this being the case as low as possible
whatever alpha is, to reject the null, the probability level has to be less than that number
E.G. if its .25, and its less than that, that means its less than .25 probability that the decision is wrong
Type II (false negative) (also symbolized by beta)
When you DONT reject the null, but there actually WAS a difference that you missed
saying something doesn’t exist when it does
we want to make the probability of this being the case as low as possible
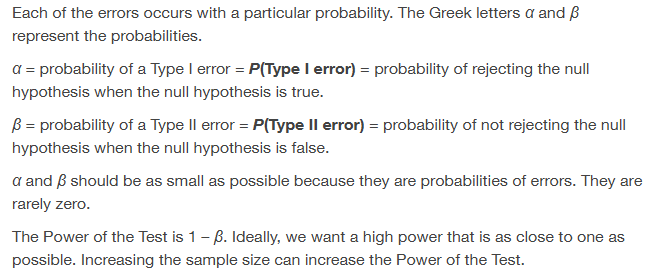
determined by: significance level, effect size, and the sample size
the smaller the sig level, the more difficult it is to reject the null. however, this makes it easier to accidentally reject results that were a lil higher than the sig level (e.g. if a = .001)
Effect Size (represented by r or correlation coefficient)
is the magnitude of the effect
to find unassuming findings, the smaller the effect size, the better
however, even a small effect can be statistically significant if the sample is large
e.g. out of thousands of people, most report some effect, even if it was consistent throughout the
aka the practical significance of the data
Sample Size
the larger the sample size, the more likely there is to be a significant results
if a sample is too small, you may not be able to detect a difference/relation, even if it exists
To determine how big your sample should be, you have to do a power analysis
it selects a sample size based on a desire probability of correctly rejecting the null hypothesis
the power is 1-beta (so it is also the probability of correctly rejecting the null
can use the power analysis command in a stats software to find the sample size you need
enter the significant levl, effect size, and the desired power
it’ll give you the sample size you need to get the results you’re looking for or what you’d need to reject the null, if you can
this is very important to do for a research proposal if you’re trying to get a grant e.g. NSF grant to get them to fund the research to determine how much
e.g.

Significance Level and t-Distributions
Two-tailed test Significance Levels
we are testing if the sample mean is sig diff than parameter in either direction (bc it doesn’t measure just one, it is considered non-directional test
Ho would be M=mu
Ha would be M does NOT = mu
we can set the sig level alpha at .05 so the critical value for significance would be z= plus or minus 1.96
a z-score > 1.96 or (,-1.96) would result in rejecting the Ho, because the score is in the zone of rejection
if -1.96 < z-score < -1.96, we cannot reject the Ho

This is why we use T-distributions
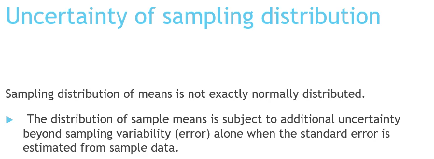
We use T instead of z, and specifically when":
the sample size is small
the population standard deviation is unknown
The math behind T-distributions
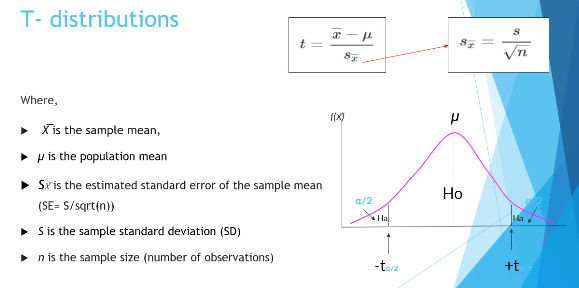

The rows are hte degrees of freedom
the columns are significance levels
Combining the two tell you the critical value that tell you if the means match
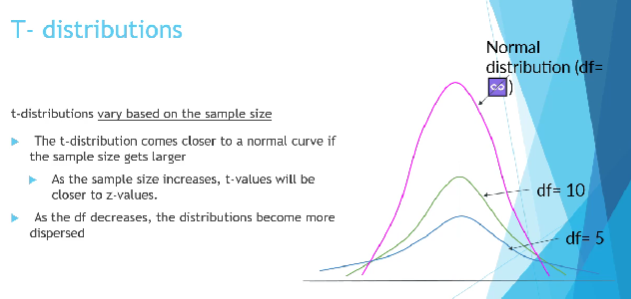
The larger the sample=size, the more normal the curve/ distribution is, and the closer the T and Z values are.
when the df decreases, the distributions become more dispersed (less kurtotic, as well
One sample T-test
if the sample mean is a good estimate of the population mean

Steps of hypothesis testing for

Let’s break down the steps more
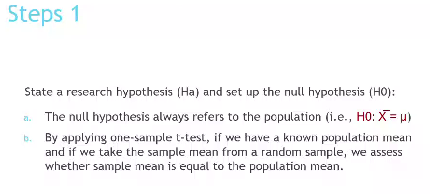

the zone of rejection is diff for the two tail (looks at both ends) and one tail (only looks at one end)


Textbook Notes
Hypothesis testing consists of two contradictory hypotheses or statements, a decision based on the data, and a conclusion.
How to perform a hypothesis test, a statistician will:
Set up two contradictory hypotheses.
Collect sample data (in homework problems, the data or summary statistics will be given to you).
Determine the correct distribution to perform the hypothesis test.
Analyze sample data by performing the calculations that ultimately will allow you to reject or decline to reject the null hypothesis.
Make a decision and write a meaningful conclusion.
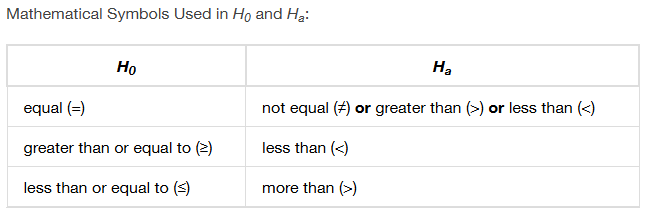
What is the goal with H0 and Ha
the result where nothing happens or there is not enough evidence that something that matters happened
Ha: that there is enough data that something ‘rare’ happened that the data from the measurements and statistical calculation supports enough. aka the info is sufficient or insufficient to reject the null


How to make p-value make more sense:
Use the sample data to calculate the actual probability of getting the test result, called the p-value. The p-value is the probability that, if the null hypothesis is true, the results from another randomly selected sample will be as extreme or more extreme as the results obtained from the given sample.
Lecture Notes
Issues from Lab 3
Lower fence means Q1-1.IQR
Upper fence means Q3+1.5IQR
Step1 (set hypothesis)
Ho The pop mean is equal to 12
H1: pop mean is diff from 12
Step 2 (set the alpha level)
= .05
Step 3 (choose and perform test)
t(2536) = 27.508, p<.001
step 4
p-value is less than alpha so we reject h0 and reatin h1
step 5
one sample t est revealed that the smaple mean is blank of education was sgnitifcantly diff than the rest value of 13 (2356) =
.02 is small .95 is medium
.08 is a large cohen’s d effect size