Efficiency of market outcomes
3 Key Ideas:
Incentive: People tend to act in ways they believe are in their best interests, based on the information they have and their ability to understand it.
Opportunity cost: People should make decisions based on what they must give up when choosing one action over the next best alternative.
Equilibrium: When everyone is doing what’s best for them based on the situation, nothing will change unless the situation changes.
Economics in Business Decision-Making:
Microeconomics: Helps with pricing, production, wages, input costs, and resource allocation.
Game Theory: Anticipate competitor actions and market strategies.
Consumer Interaction: Understand demand to identify profit opportunities.
Macroeconomics: Guides decisions based on business cycles, labour markets, trade, exchange rates, and government policies (fiscal & monetary).
Allocation of resources + roles of markets
Gov owns rights to resource + for them to determine how much is given to each household and firm → based on how many ppl in each household
Gov use of voucher/ ration coupons (using example of water) → gives water users some control over when resource is accessed
Individuals become self-sufficient (autarky) → only feasible if individuals can access sufficient quantity of resource themselves w.r.t what they need.
Market trading:
Helps evaluate based on efficiency (maximizing output) or equity (fairness in distribution)
Used to compare different options
Pareto efficiency→ No one can gain without someone else losing i.e. maximising welfare.
Maximising welfare → Getting the most benefit from limited resources
3 types of efficiency:
Allocative → Producing optimal amount with available resources
Productive → Producing amount using fewest resources i.e. minimising cost
Dynamic → Innovating to make more with the same resources over time
Market outcome → When supply = demand
i.e. Qd = Qs
Equation for economic welfare:
W = CS + PS
W = economic welfare
CS = Consumer Surplus ( area below demand curve + above market price)
PS = Producer Surplus ( area above supply curve + below market price)
Supply and demand curves
Demand curve: Shows the relationship between price and quantity demanded of a particular product.
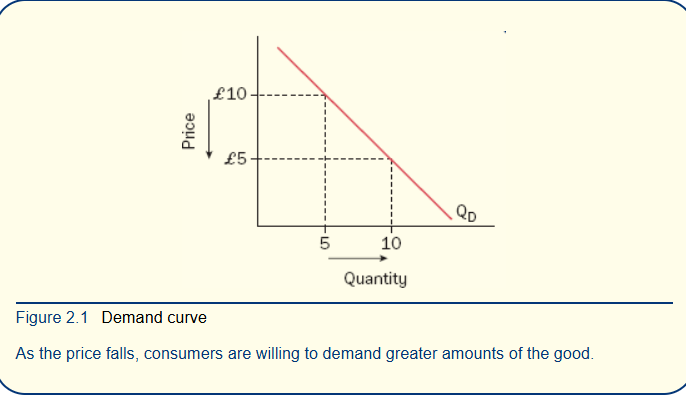
The negative relationship between price and quantity demanded reflects the affordability of a product to consumers. As a product becomes cheaper consumers can buy more for a given amount of income.
There are a number of other circumstances which will lead to an increase or decrease in the number of customers, or an increase or decrease in the amount of units demanded by customers. These circumstances are:
Price of substitutes and complements
Consumer income
Tastes and preferences
Price expectation
Market equilibrium
Where demand and supply meet is known as the market equilibrium.
Firm supply curve → how much a firm is willing to sell each unit produced for, given existing tech + inputs of production (their costs)
Market supply curve → sum of how much all firms in the market are willing to sell at different price levels