Reliability
Definition (#f7aeae)
Important (#edcae9)
Extra (#fffe9d)
Reliability:
The consistency or stability of measurement results when a psychological test is administered under comparable conditions.
Answers: "Does this test produce the same results repeatedly?"
The reliability coefficient quantifies this consistency as the ratio of true score variance to total variance (r = σ²T / σ²X).
Values range from 0 to 1, with higher values indicating greater consistency.
Without consistent measurement, we cannot draw meaningful conclusions about what a test actually measures.
Classical Test Theory (CTT) basics:
Classical Test Theory provides the foundational framework for understanding measurement reliability:
Core Formula: X = T + E (Observed Score = True Score + Error)
Variance Decomposition:
σ²X = σ²T + σ²E
Total variance equals true score variance + error variance.
Reliability Coefficient:
r = σ²T / σ²X
The proportion of observed variance attributable to true differences
This model assumes errors are random, uncorrelated with true scores, and average to zero across repeated measurements.
Types of measurement error:
Random Error: Unpredictable fluctuations in measurement that occur by chance. These errors vary unsystematically across testing occasions and directly reduce reliability coefficients. Ex: Environmental distractions.
Systematic Error: Consistent, predictable bias that affects scores in the same direction. While systematic error distorts true scores, it does not affect the reliability coefficient because it adds constant variance. Ex: Biased item wording, or consistent examiner influence.
Key Distinction: Only random error reduces reliability; systematic error affects validity instead.
Source of error variance:
Understanding the sources of measurement error is essential for improving test reliability.
6 main categories of error variance affect psychological measurements:
Test Construction: Item sampling, content coverage, wording differences across test versions.
Test Administration: Environmental factors including temperature, noise, lighting, and distractions.
Test-taker Variables: Fatigue, health, emotional state, anxiety, misreading instructions.
Examiner Variables: Behavior, cues, rapport, tone of voice, unintentional cues affecting responses.
Scoring & Interpretation: Rater judgments.
Other Factors: Response biases, external influences.
Variance distribution:
Helps identify where to focus reliability improvement efforts.
True score variance represents the meaningful, consistent portion of measurement.

Reliability standards:
.90: Excellent reliability for high-stakes individual decisions.
80–.89: Good reliability suitable for most assessment purposes.
70–.79: Acceptable for group-level decisions and research.
.70: Poor reliability — interpret with caution, avoid critical decisions.
Higher coefficients indicate greater consistency and less measurement error in test scores.
Types of reliability overview:
Test–Retest Reliability: Measures consistency of scores over time by administering the same test twice to the same group.
Alternate/Parallel Forms: Assesses equivalence between different versions of a test measuring the same construct.
Internal Consistency: Evaluates how well items within a single test correlate with each other (split-half, Cronbach's alpha).
Inter-Scorer Reliability: Determines agreement between different raters or examiners scoring the same responses.
Test-retest reliability:
Measures the stability of test scores over time by administering the same test to the same individuals on 2 separate occasions. The correlation between the 2 sets of scores indicates temporal consistency.
Key Characteristics:
Appropriate for measuring stable traits (personality, intelligence).
Error source: Time sampling—fluctuations between testing occasions.
Coefficient of stability: Correlation between Time 1 and Time 2 scores.
Ex:
Personality assessment administered 2 weeks apart.
Cognitive ability testing with a 1 month interval.
Aptitude measures for career counseling.
Considerations: Practice effects and genuine trait changes can affect results.
Alternate forms of reliability:
Assesses the equivalence between 2 different versions of a test designed to measure the same construct.
Reduces memory effects that can inflate test-retest correlations when the same items are administered twice.
Advantages: Ability to retest individuals without practice effects and to verify that different item sets measure the same underlying trait.
Error sources in this approach stem from both item sampling (differences between forms) and time sampling when forms are administered on different occasions.
The correlation between scores on the 2 forms serves as the reliability coefficient, with higher values indicating greater equivalence between test versions.
Internal consistency reliability:
Assesses how well items within a single test measure the same construct.
Requires only 1 test administration, making it practical and efficient.
Primary error source is content sampling - whether selected items adequately represent the full domain.
Common measures include split-half reliability (correlating two test halves) and Cronbach's alpha (average of all possible split-half correlations).
Alpha values above .70 are generally acceptable, while values above .90 may indicate item redundancy.
This approach is ideal for homogeneous tests measuring a unified construct.
Inter-scorer reliability:
Measures the consistency of scores assigned by different raters or examiners when evaluating the same response or behavior.
Key Concepts:
Assesses agreement between 2 or more independent scorers.
Critical for subjective assessments (essays, clinical interviews, behavioral observations).
Error source: Rater variability in judgment and interpretation.
Clinical ex:
Diagnostic interviews requiring clinical judgment.
Behavioral rating scales in therapy settings.
Educational ex:
Essay scoring and written response evaluation.
Performance-based assessments and portfolios.
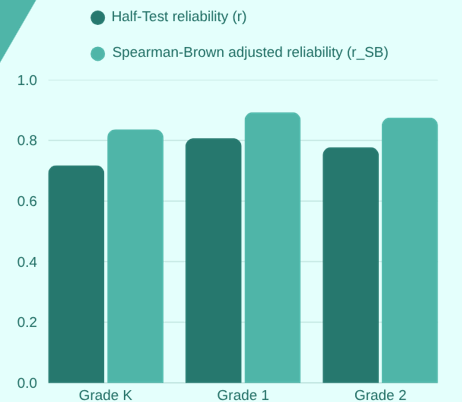
Split half reliability data:
Assesses internal consistency by correlating two halves of a test.
The Spearman-Brown correction adjusts for test length:
r_SB = 2r_hh / (1 + r_hh)
Grade K: Half-Test r = .718 → Adjusted r_SB = .836
Grade 1: Half-Test r = .807 → Adjusted r_SB = .893
Grade 2: Half-Test r = .777 → Adjusted r_SB = .875
Adjustment increases reliability.
The correction compensates for reliability underestimation when using only half the test items.
KR-20 reliability: Examples
HERT test analysis:
Check if yes/no questions are measuring the same thing.
Number of items (k) = 18
Sum of item variances (Σpq) = 3.975
Total test variance (σ²) = 5.26
Calculated KR-20 Coefficient:
r_KR20 = (k/(k-1)) × (1 - Σpq/σ²).
r_KR20 = (18/17) × (1 - 3.975/5.26) = .259
Interpretation: This low reliability coefficient (.259) indicates heterogeneous test content, suggesting items measure different constructs rather than a unified trait.
Cronbach’s alpha overview:
Widely used measure of internal consistency reliability, particularly suited for items with multiple scoring categories.
Formula:
α = (k/(k-1)) × (1 - Σσ²ᵢ / σ²total)
Where k = number of items, Σσ²ᵢ = sum of item variances, and σ²total = total test variance.
Interpretation guidelines:
α > .90: Excellent, but may indicate item redundancy
• α = .80–.89: Good reliability
• α = .70–.79: Acceptable
• α < .70: Questionable, needs revision
Note: Values exceeding .90 suggest items may be too similar, measuring redundant content rather than breadth of the construct.
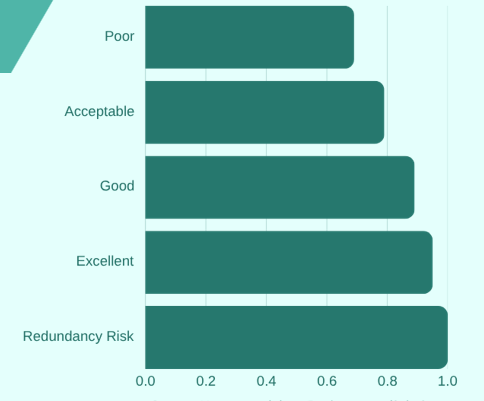
Visualising Cronbach’s alpha:
Cronbach's alpha interpretation thresholds:
α < .70: Poor reliability - results unreliable.
α .70–.79: Acceptable - use with caution.
α .80–.89: Good - suitable for research.
α > .90: Excellent - but may indicate redundancy.
Note: Very high alpha (>.95) suggests items may be measuring the same thing repeatedly, reducing test efficiency.
Dynamic vs static traits:
Dynamic traits: Characteristics that naturally fluctuate over time, such as mood, anxiety levels, or fatigue. For these variables, test-retest reliability is less applicable since score changes may reflect genuine trait variation rather than measurement error.
Static traits: Remain relatively stable over time, including personality characteristics, cognitive abilities, and aptitudes. Test-retest reliability is well-suited for measuring these constructs, as consistent scores across administrations indicate reliable measurement.
Implications for test design: Match your reliability assessment method to the trait's temporal nature. Use internal consistency measures for dynamic traits and test-retest for stable characteristics.
Restriction of range effect:
When the range of scores in a sample is narrower than in the population, observed reliability correlations are artificially reduced.
This phenomenon occurs when testing homogeneous groups rather than diverse populations.
Ex: If a university admits only students with IQ scores above 120, the correlation between IQ and academic performance will appear lower than in the general population. The reduced variability masks the true relationship between variables.
Implications: Researchers must consider sample characteristics when interpreting reliability coefficients and may need statistical corrections to estimate true population reliability.
Speed vs power test:
Speed Tests: Time-limited assessments requiring rapid responses; reliability affected by time constraints and response rate.
Power Tests: Untimed assessments where difficulty determines performance; reliability focuses on item difficulty progression.
Key Difference: Speed tests measure how quickly examinees respond, while power tests measure how well they handle increasingly difficult items.
Reliability Methods: Each test type requires different estimation approaches to accurately assess measurement consistency.
Reliability in criterion-referenced tests:
Criterion-referenced tests focus on mastery of specific content domains rather than comparing individuals to normative groups. This fundamental difference creates challenges for traditional reliability estimation.
Limitations of Classical Coefficients:
Low score variability reduces reliability estimates artificially.
Mastery decisions create bimodal distributions.
Internal consistency measures may be inappropriate.
Alternative Approaches:
Decision consistency indices (proportion of consistent classifications).
Kappa coefficient for agreement beyond chance.
Domain score estimation methods.
Generalizability theory applications for mastery testing.
Generalizability theory:
Generalizability Theory (G-Theory) extends Classical Test Theory by partitioning error variance into multiple distinct sources called "facets."
Unlike CTT's single error term, G-Theory identifies specific facets such as raters, occasions, items, and settings that contribute to measurement variability.
Advantages over CTT:
Simultaneous estimation of multiple error sources.
Flexibility to generalize across different measurement conditions.
Decision studies (D-studies) to optimize test design.
More precise reliability estimates for complex assessments
G-Theory provides a comprehensive framework for understanding and improving measurement precision in psychological assessment.
Item response theory:
Item Response Theory represents a modern psychometric approach that focuses on the relationship between latent traits and item responses.
Core Concepts:
Latent trait (θ): The underlying ability or characteristic being measured, estimated from response patterns.
Item difficulty (b): The trait level at which examinees have a 50% probability of correct response.
Item discrimination (a): How well an item differentiates between high and low trait levels.
Advantages for Test Development:
Sample-independent item parameters
Item-level measurement precision
Adaptive testing capabilities
More accurate reliability estimation across the trait continuum.
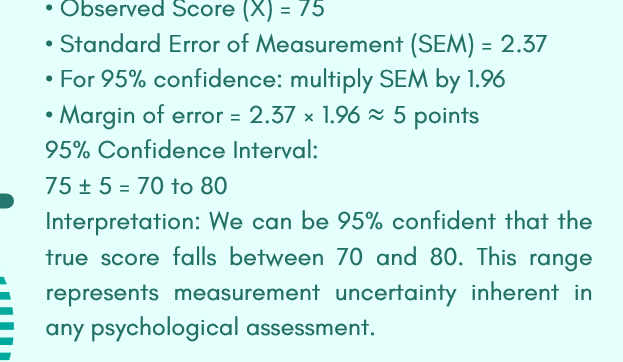
Standard error of measure:
The Standard Error of Measurement (SEM) quantifies the expected range of error in an individual's observed score.
Calculated using: SEM = σ√(1-r)
σ is the standard deviation of test scores and r is the reliability coefficient.
Interpretations:
SEM represents the standard deviation of errors around a true score.
Smaller SEM indicates more precise measurement.
Used to construct confidence intervals around observed scores.
A 95% CI = Observed Score ± 1.96(SEM)
Practical importance: SEM helps clinicians and researchers understand that any single test score contains measurement error, guiding appropriate caution in score interpretation and decision-making.
Example:
Worked example with data:
Comparing scores example:
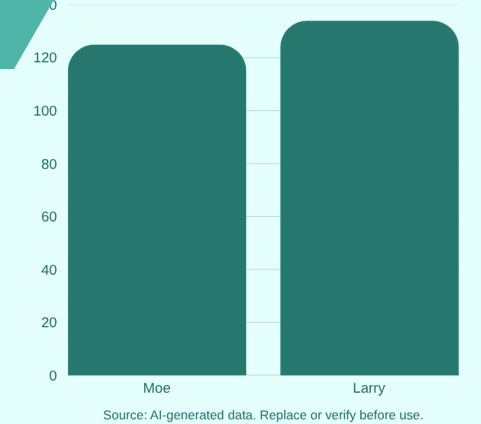
Statistical Test of Score Difference Significance:
Moe's Score: 125
Larry's Score: 134
Observed Difference: 9 points
Standard Error of Difference (S_diff): 5.6
Required Difference for 95% Significance: 11.2
Conclusion: The 9-point difference does not exceed the critical value of 11.2, therefore the difference is not statistically significant at the 95% confidence level.
Summary:
Reliability reflects the consistency and stability of measurement results.
Multiple error sources affect scores: test construction, administration, test taker, examiner, and scoring factors.
True variance typically accounts for ~67% of total variance.
4 main reliability types: test-retest, alternate forms, internal consistency, and inter-scorer.
Advanced methods (Generalizability Theory, IRT) improve measurement precision.
SEM provides confidence intervals for individual score interpretation.