Correlations Pt. 1
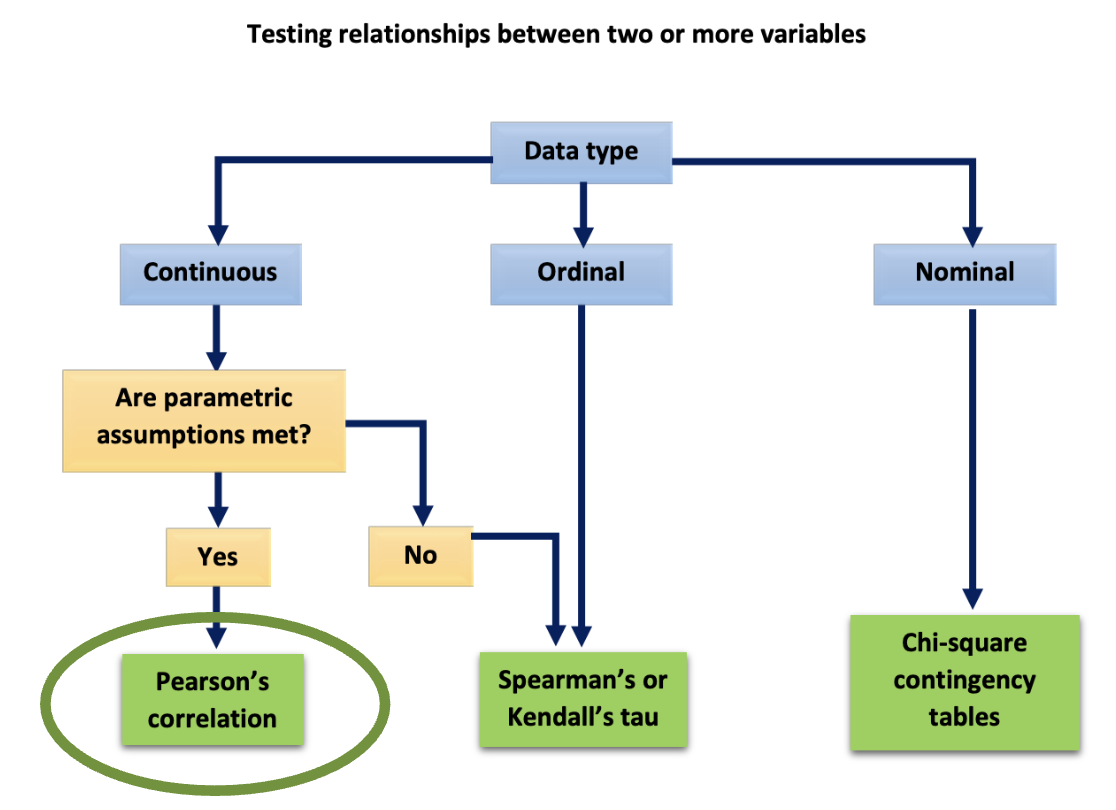
when to use the Pearson correlation statistic
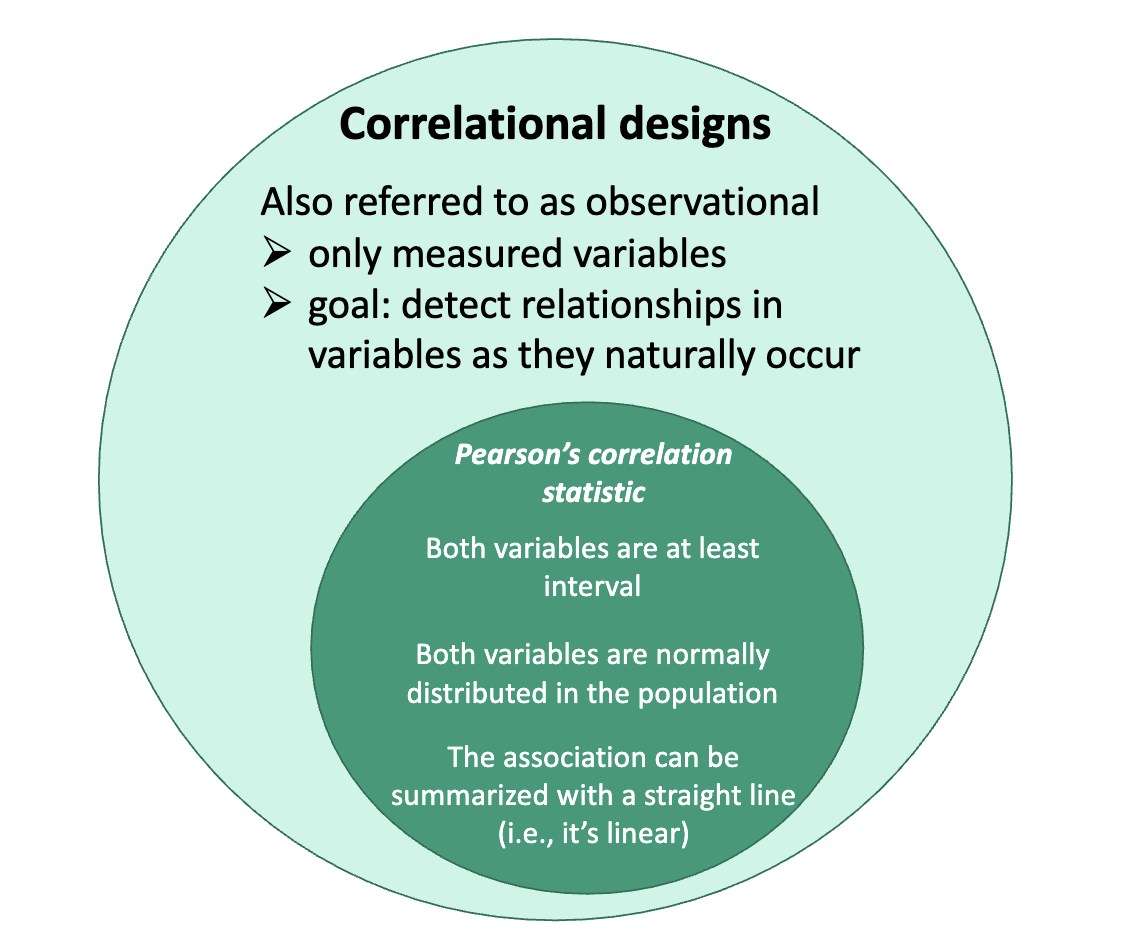
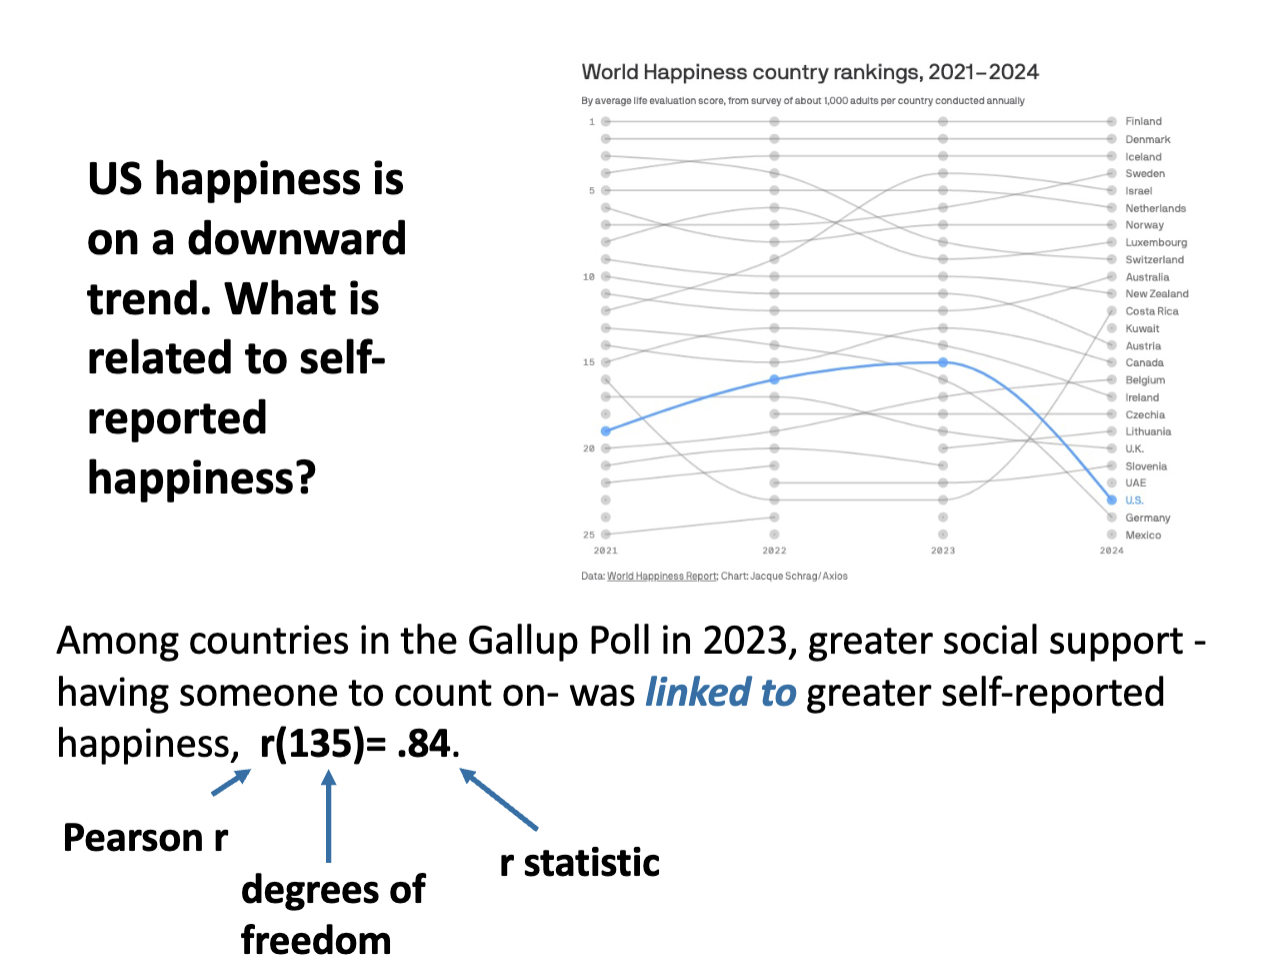
correlation statistic: the strength and direction of the relationship between two quantitative variables
example of measured quantitative variables:
age
time to finish a marathon in minutes
number of details you can remember about a story you just heard
number of games won in a season
number of alcoholic drinks per week
number of steps per day
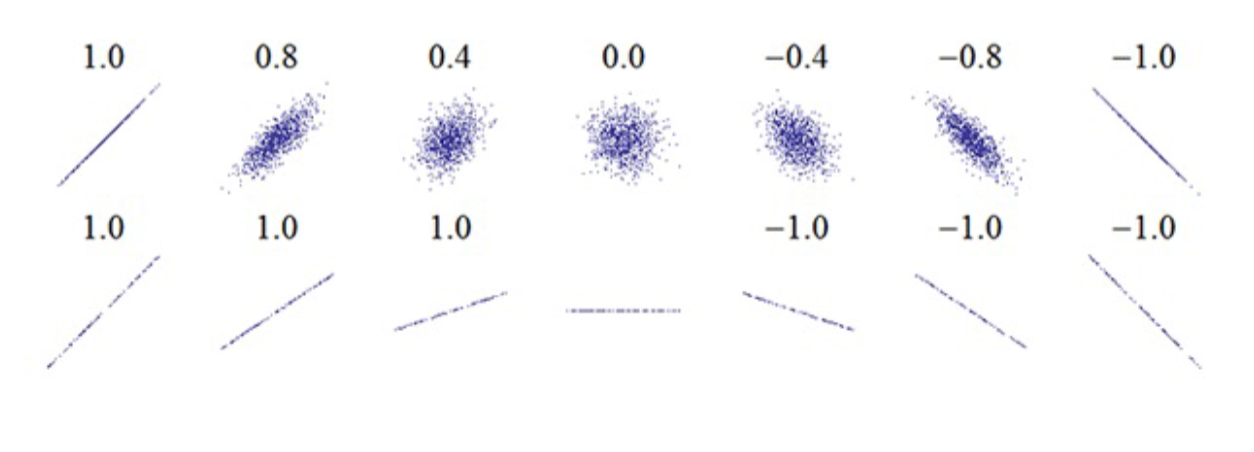
correlation statistics are only for linear relationships that can be modeled or “fit” with a straight line
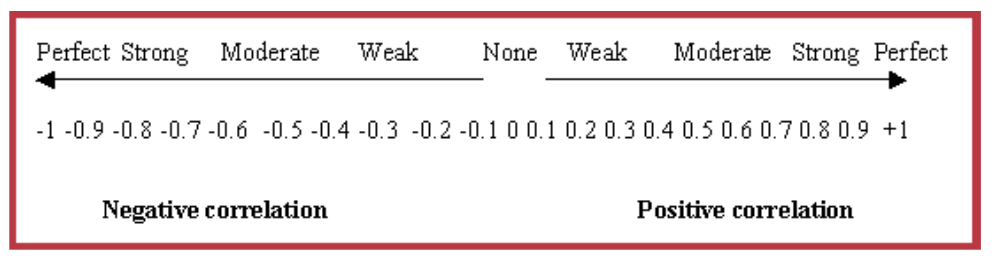
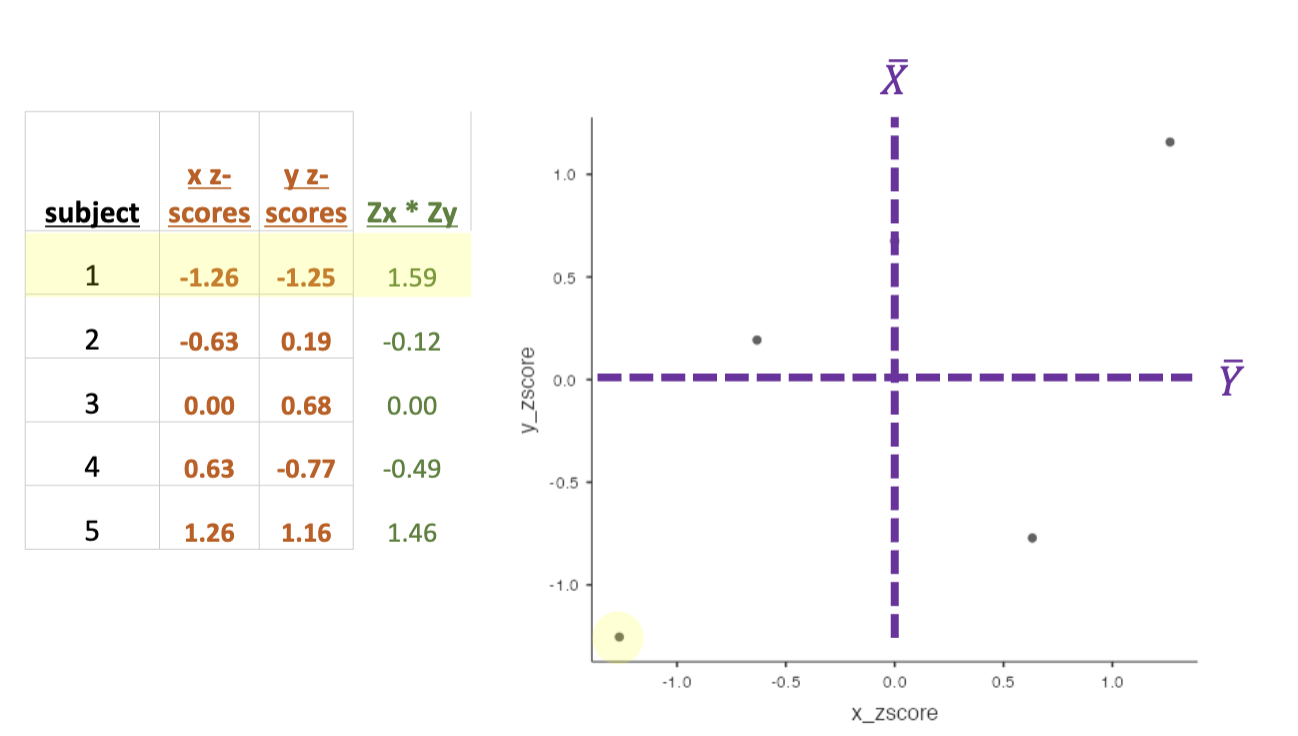
the strength of the correlation can be visually estimated by how close the points are to a trend line
range -1 to 1
the direction is shown by the slope
positive/negative
r is a “unitless” descriptive statistic
r does not reflect the original units of the variables
r is an effect size for the strength of the relationship
effect sizes are comparable across different variables and studies
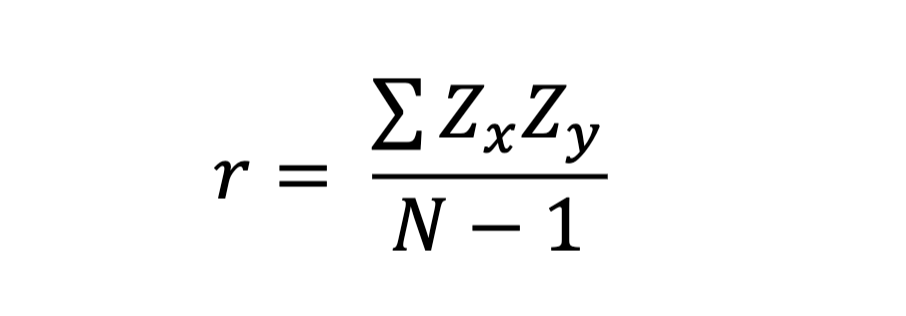
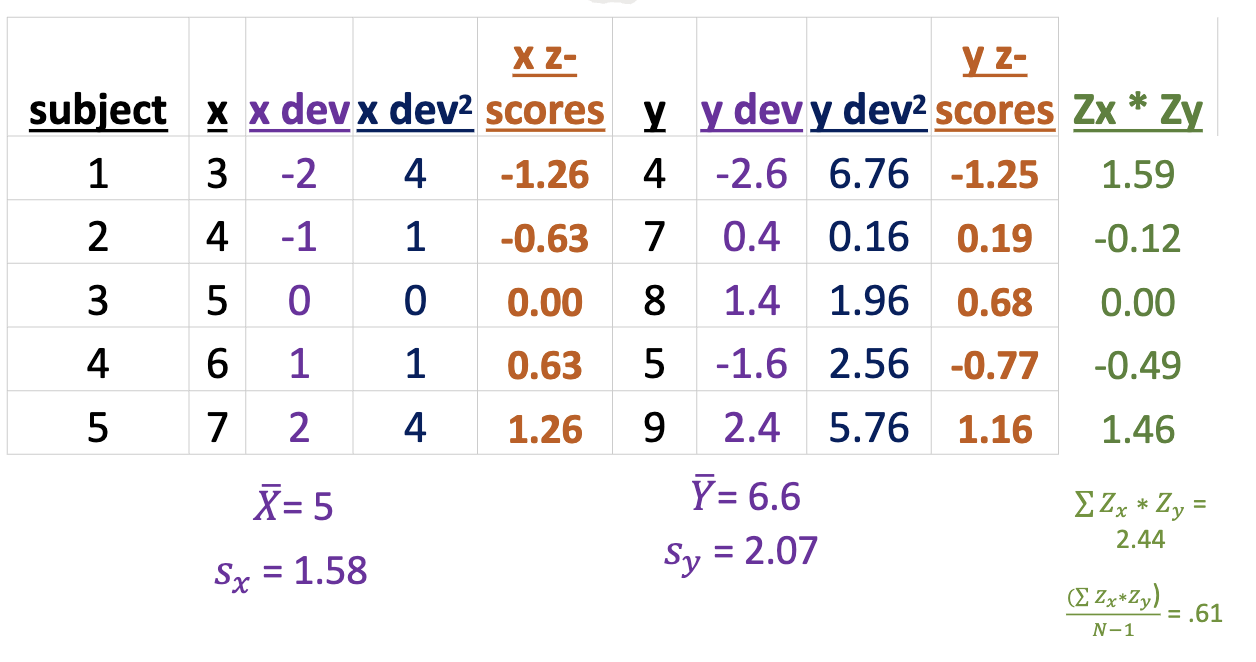
steps to compute the Pearson correlation statistic
computing r
how to describe your correlation result in words
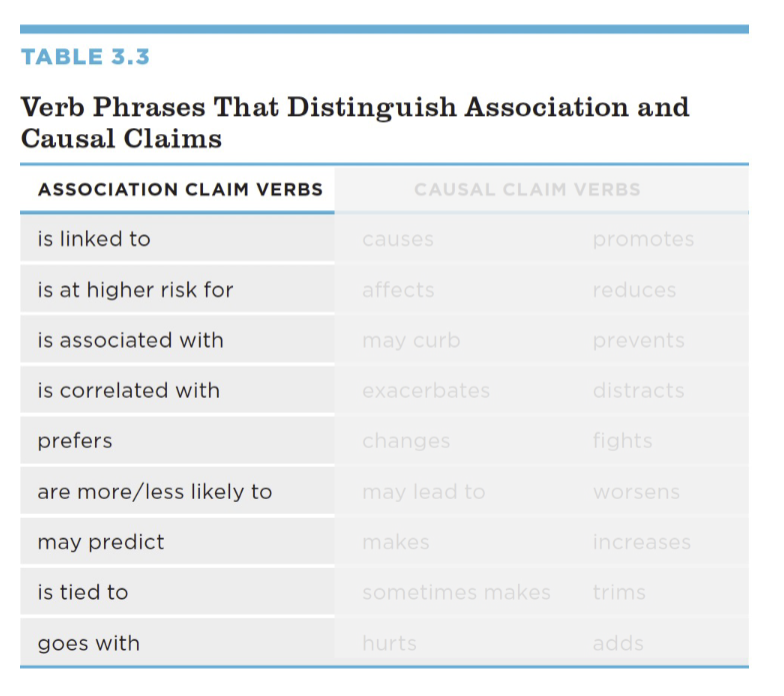
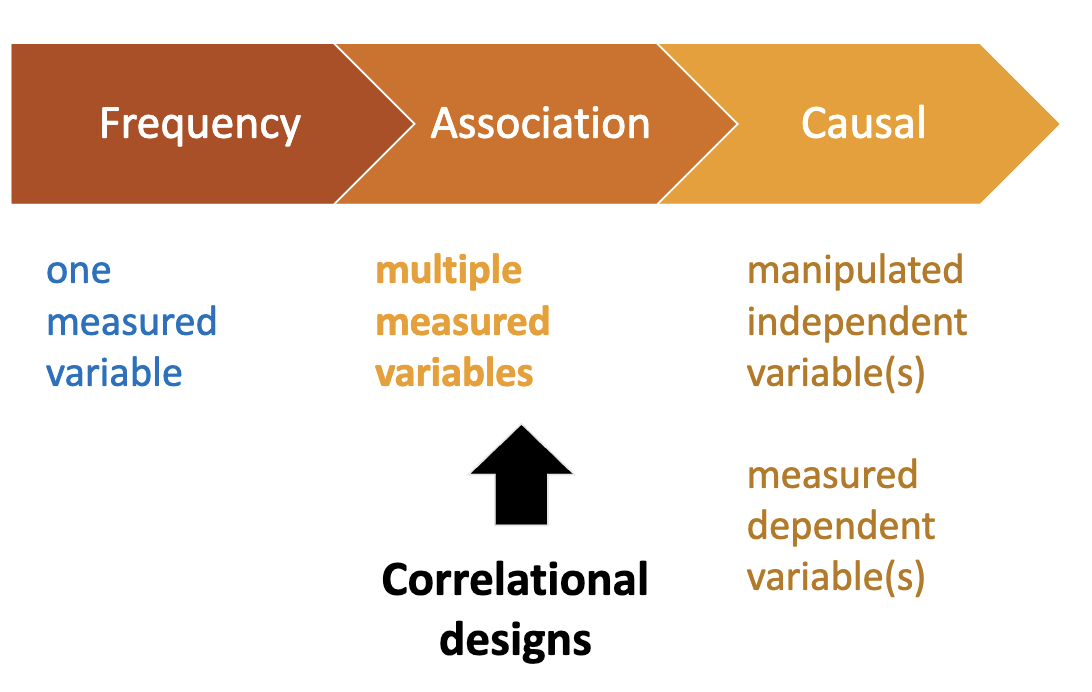
association claims: assert that two variables are related to each other
the frequency of one variable is tied to or linked with the frequency of another
pearson correlation statistics support association claims