OSCM 373: Management of Quality & Quality Control
Quality Management
Quality: The ability of a product or service to consistently meet or exceed customer expectations.
Dimensions of Product (Good) Quality
Performance: Main functional characteristics of the product.
Aesthetics: Appearance, feel, smell, taste.
Special Features: Extra characteristics.
Conformance: How well the product conforms to design specifications.
Reliability: Dependable performance.
Durability: Ability to perform over time.
Perceived Quality: Indirect evaluation of quality (reputation).
Serviceability: Handling of complaints or repairs.
Source: Garvin, 1987
Dimensions of Service Quality
Convenience: The availability and accessibility of the service.
Reliability: Ability to perform a service dependably, consistently, and accurately.
Responsiveness: Willingness to help customers in unusual situations and to deal with problems.
Time: The speed with which the service is delivered.
Assurance: Knowledge exhibited by personnel and their ability to convey trust and confidence.
Courtesy: The way customers are treated by employees.
Tangibles: The physical appearance of facilities, equipment, personnel, and communication materials.
Consistency: The ability to provide the same level of good quality repeatedly.
Benefits of Good Quality
Enhanced reputation (for quality).
Increased market share.
Ability to charge higher prices.
Greater customer loyalty.
Lower liability costs.
Fewer production or service problems.
Lower production costs.
Higher profits.
Consequences of Poor Quality
Loss of business.
Lower Productivity.
High Failure Costs.
Liability.
Costs of Quality
Prevention Costs: Cost of preventing defects from occurring.
Planning, administration, working with vendors, training, quality assurance, design and production.
Appraisal Costs: Costs of activities designed to ensure quality or uncover defects.
Inspectors, testing, test equipment, labs, quality audits, quality control, field testing.
Failure Costs: Costs incurred by defective parts/products or faulty services.
Internal Failure Costs: Costs incurred to fix problems that are detected before the product/service is delivered to the customer.
External Failure Costs: All costs incurred to fix problems that are detected after the product/service is delivered to the customer.
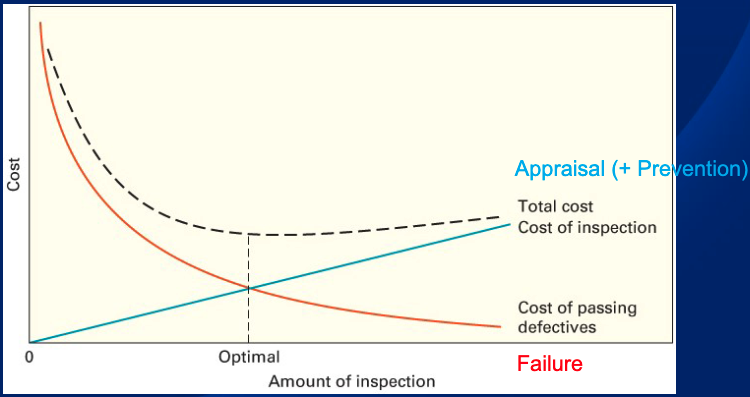
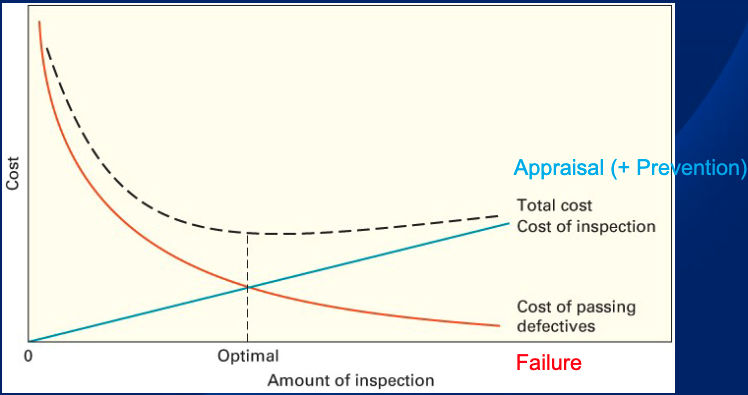
Costs of Quality Chart
Illustrates the relationship between inspection costs and failure costs to determine an optimal amount of inspection.
Process Variability
Variability always exists in the output of a process.
Types of Variation:
Random Variation: Natural variation in the output of a process, created by countless minor factors.
Assignable Variation: Nonrandom variation whose cause can be identified.
Two Basic Questions Concerning Variability
Is the process In-Control?
Are the variations random?
If nonrandom variation is present, the process is said to be unstable.
What is the process Capability?
Given a stable process (in-control), is the inherent variability of the process within a range that conforms to performance criteria?
What is Quality Control?
Quality Control: A process that evaluates output relative to a standard and takes corrective action when output doesn’t meet standards.
If results are acceptable, no further action is required.
Unacceptable results call for correction action (appraisal cost).
Inspection
Inspection: An appraisal activity that compares goods or services to a standard.
Inspection Issues:
What to inspect
Count the number of times a defect occurs.
Measure the value of a characteristic.
Where in the process to inspect.
How much to inspect and how often
Full Inspection vs. Sampling
Costly, possibly destructive, and disruptive – non value-adding.
Where to Inspect in the Process?
Typical Inspection Points:
Raw materials and purchased parts.
Finished products.
Before a costly operation.
Before an irreversible process.
How Much to Inspect?
Finding the optimal amount of inspection involves balancing the cost of inspection against the cost of passing defectives.
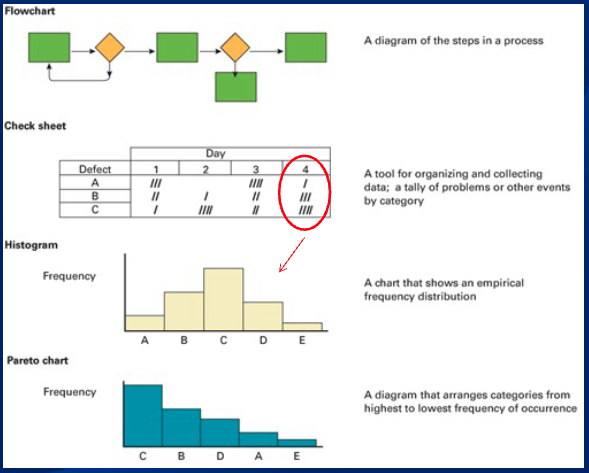
Basic Quality Tools (TQM)
Flowchart: A diagram of the steps in a process.
Check Sheet: A tool for organizing and collecting data; a tally of problems or other events by category.
Histogram: A chart that shows an empirical frequency distribution.
Pareto Chart: A diagram that arranges categories from highest to lowest frequency of occurrence.
Statistical Process Control (SPC)
Statistical evaluation of the outputs of a process.
Periodically taking samples of process output (out of all the outputs).
Computing sample statistics such as:
Sample average
The number of occurrences of some outcome
Sample statistics are used to judge the randomness of process variation.
Decide if:
a process is “in control” or
if it is “out of control” and corrective action is needed
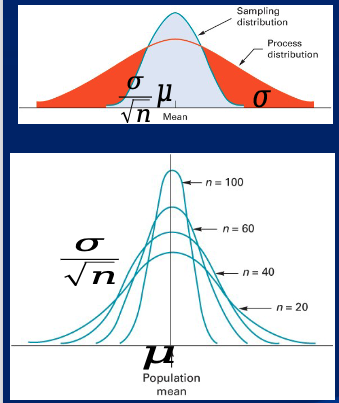
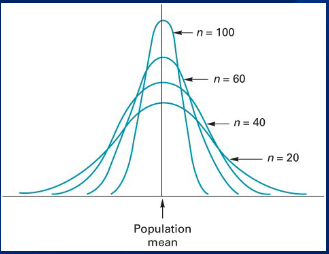
Sampling Distribution
Illustrates the relationship between population mean, sample mean, standard deviation, and sample size.
Take a sample of n units
Calculate a sample statistic (e.g., the average)
Check if the sample statistic is “normal” – falls within its control limits (for the statistic).
Formulas:
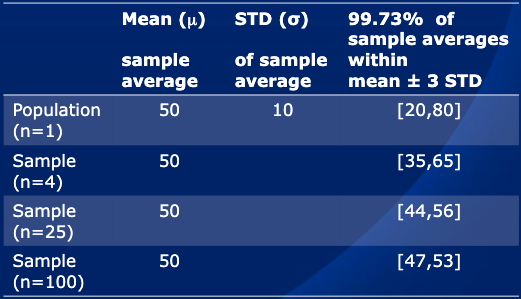
igma}{\sqrt{n}}, \mu + 3\frac{\sigma}{\sqrt{n}}]
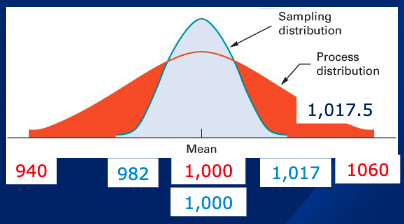
X-bar Chart
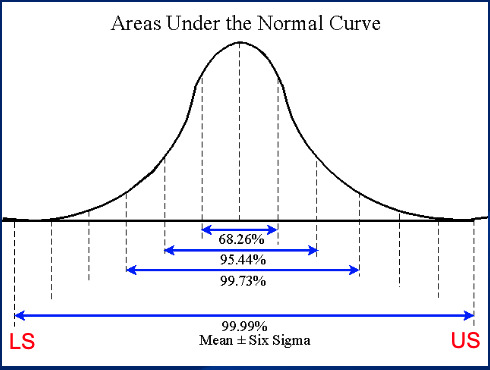
Example of a process normally distributed with mean = 1,000 and STD = 20.
99.73% within ± 3 STD.
\mu \mp 3\sigma = 1,000 \mp 3 * 20 = [940, 1,060]
Sample Control Limits are tighter than population CL.
(UCL, LCL) = \mu \mp 3 \frac{\sigma}{\sqrt{n}} = 1,000 \mp 3 \frac{20}{\sqrt{12}} = (1,017.32, 982.68)
Control Charts: The Voice of the Process
Control Chart: A time ordered plot of sample statistics obtained from an ongoing process (e.g. sample means), used to distinguish between random and nonrandom variability.
Control Limits: The dividing lines between random and nonrandom deviations from the mean of the distribution.
Upper and lower control limits define the range of acceptable variation.
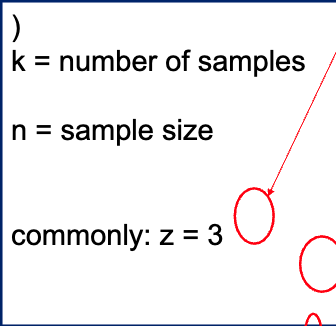
Formulas:
UCL = mean + z * STD
LCL = mean - z * STD
Z is usually 3 (99.73%).
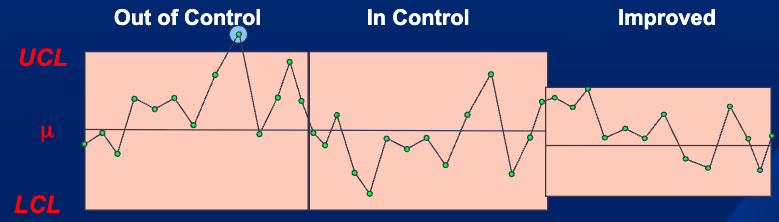
Control Chart Illustration
Visual representation of sample statistics over time with UCL and LCL.
Points outside control limits indicate abnormal variation.
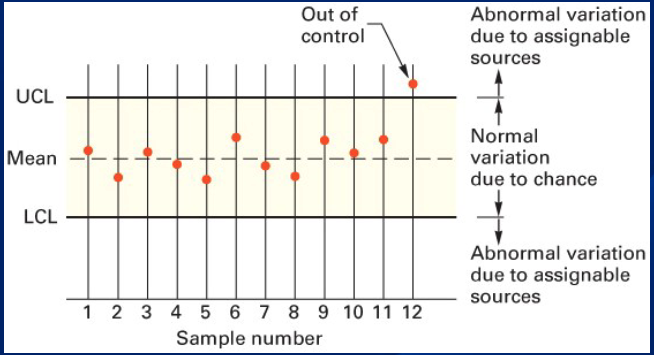
Control Chart Interpretation
Points falling outside the UCL or LCL indicate out-of-control situations due to assignable sources of variation.
x-bar (sample average) chart Control Limits
Sample mean = Population mean
Sample STD = Population STD / sqrt(Sample-size)
Formulas:
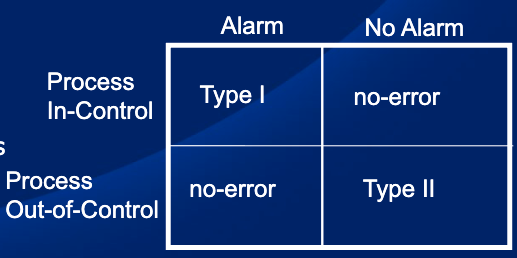
Errors
Type I error: Concluding a process is not in control when it actually is (Manufacturer’s Risk).
Narrow control limits (low z)
Type II error: Concluding a process is in control when it is not (Consumer’s Risk).
Wide control limits (high z)
Control Charts for Variables
Data that are measured
x-bar charts (Mean): Used to monitor the central tendency of a process.
R charts (Range): Used to monitor the process dispersion.
Control Charts for Attributes
Data that are counted.
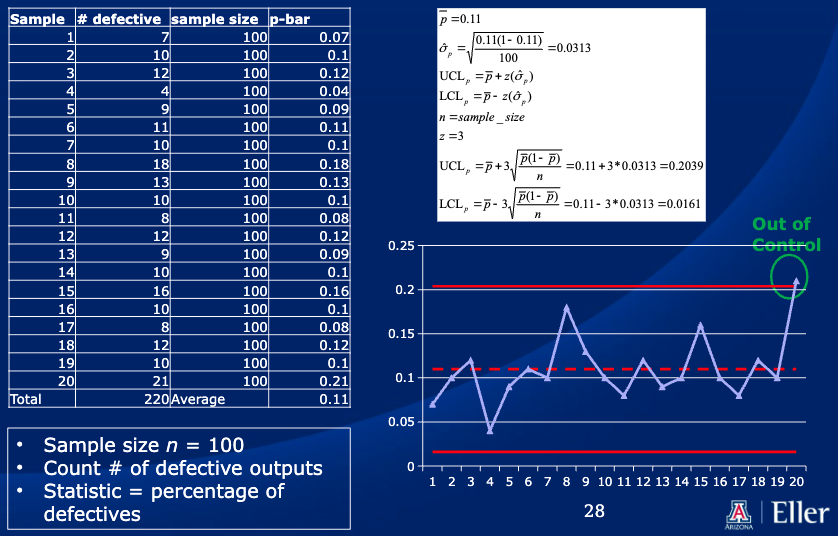
p-Chart: Control chart used to monitor the proportion of defectives in a process.
c-Chart: Control chart used to monitor the number of defects per unit.
p - chart
Units can be placed into two categories:
Good / Bad
Pass / Fail
Operate / Not-operate
Data consists of many samples of multiple (n) units each.
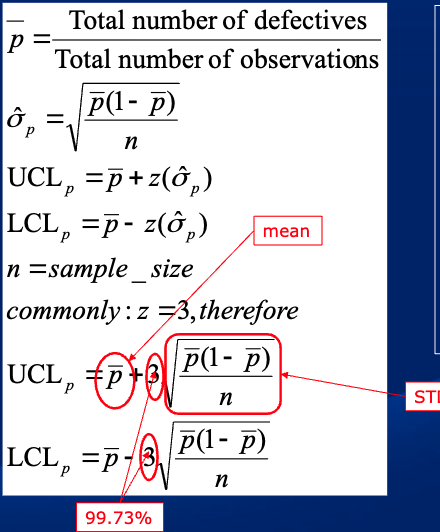
p-chart Control Limits
X: # defective
n: sample size
X ~ B(n, p): X is binomially distributed with parameters n and p. We are interested in p and therefore track the random variable X/n
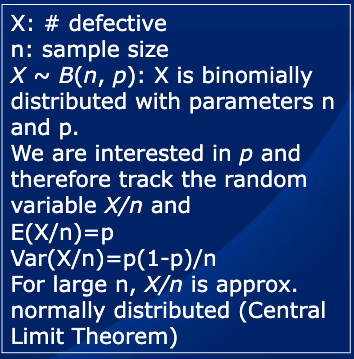
p(1-p)}{n
p-chart Example
Demonstrates calculation of p-bar, UCL, and LCL with a sample data set and identifies out-of-control points.
Control Charts - Key points
Every process displays variation in performance: normal or abnormal
Control charts monitor process to identify abnormal variation
Do not tamper with a process that is "in control" with normal variation
Correct an "out of control" process with abnormal variation
Control charts may cause false alarms – too narrow - (or missed signals – too wide) by mistaking normal (abnormal) variation for abnormal (normal) variation
Process Capability
Once a process has been determined to be stable, it is necessary to determine if the process is capable of producing outputs that are within an acceptable range.
Specifications: Range of acceptable values established by engineering design or customer requirements [US, LS]
Process Capability: The inherent variability of process output (process width) relative to the variation allowed by the design specification (specification width)
Capability Ratios: Cpk, Cp, S
Sigma Capability Ratio for a Centered Process: S = \frac{Upper \ Spec - Lower \ Spec}{2\sigma}
Six Sigma
Sigma Capability Ratio for a Centered Process: S = \frac{Upper \ Spec - Lower \ Spec}{2\sigma} = 6$$
Six Sigma (Detailed)
Six Sigma: A methodology for improving quality, reducing costs, and increasing customer satisfaction.
Statistically: Having no more than 3.4 defects per million.
Conceptually: Sustained quality improvement that requires commitment from the entire organization ("Champions", "Master Black Belts", "Black Belts", "Green Belts", “Yellow belts”).
Every manufacturing and business processes have characteristics that can be measured, analyzed, improved and controlled.
Continuous efforts to achieve stable and predictable process results (i.e., reduce process variation/defects).
Process Improvement DMAIC: Define, Measure, Analyze, Improve, Control
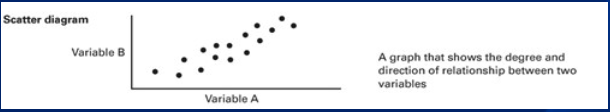
Basic Quality Tools - Additional
Scatter diagram: A graph that shows the degree and direction of relationship between two variables
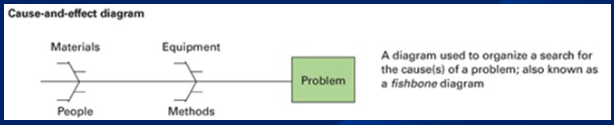
Cause-and-effect diagram: A diagram used to organize a search for the cause(s) of a problem; also known as a fishbone diagram
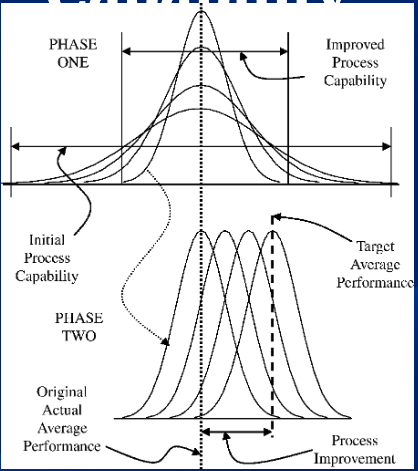
Improving Process Capability
Reduce Variability
Shift (center) the Mean (between specs)
Operations Strategy
Customers are very concerned with quality of goods and services
Quality is a strategic imperative.
Requires:
Careful Product and Service design
Quality assurance & control
Increase Capability
Quality improvement is a never-ending journey – organizational members should understand & participate
Quality throughout the entire supply chain, not just the organization itself
“Quality is free”
Spending money on prevention saves even more money on failure costs.
It is possible to have high quality and (relatively) low cost at the same time.
“quality is free” (Crosby), and firms should get it “right the first time.”