The Market System (ch. 5-8)
The Supply Curve:
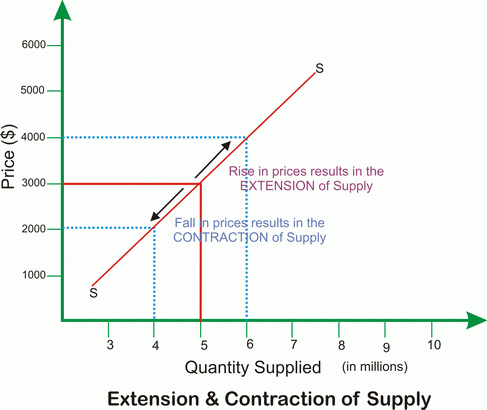
Supply is the amount that producers are willing to offer to sell at different prices in a given period of time. The supply curve is a line drawn on a graph which shows how much of a good sellers are willing to supply at given prices. There is a proportionate relationship between price and quantity supplied. This means that when prices increase, supply increases and vice versa.
If the price of a good changes, then there will be movement along the supply curve. A change in other factors (ie the FoP) can result in a shift in the supply curve. This is when it moves inwards or outwards.
Sometimes, the supply can be fixed. This means that there is a vertical supply curve. An example of this is when it is impossible for supply to be increased, such as for seats at a sports venue.
Factors Affecting Supply:
Price is the main factor which can affect supply. These include:
- Production costs - These are things such as machinery costs, wages, raw materials and rent. If the price is fixed and production costs rise, then sellers will reduce supply as their profits are reduced, and vice versa. This results in the supply curve shifting inwards.
- Indirect taxes - These are taxes on spending (ie VAT, GST). When they are imposed, then the supply curve shifts leftwards because firms have to spend more, thus reducing supply. Governments will implement these taxes to increase revenue and discourage the consumption of harmful products. When indirect taxes are increased, the supply curve shifts inwards and vice versa.
- Subsidies - This is where governments give money to firms in the form of a grant. This encourages them to produce a particular product, thus increasing supply and shifting the supply curve outwards.
- Changes in technology - Newer technology can decrease the costs of production by making it more efficient. This can increase yield (the amount of something produced), causing the supply curve to shift outwards.
- Natural Factors - These include weather, natural disasters, pests and disease. Good growing conditions increase crop yield, thus increasing supply and shifting the supply curve outwards, and vice versa.
Market Equilibrium:
You can put a demand on the supply on the same graph. The point at which they cross can be referred to as the equilibrium price (this is where supply and demand are equal). This is also known as market clearing price, which means that the amount supplied in a market matches the amount demanded, so all of the goods and services will be bought. Total revenue is the amount of money generated from the sale of goods calculated by multiplying price by quantity. It can be shown on a graph by looking at the area below the price shown.
When the demand curve and the supply curve shift, then there is a shift in the equilibrium price to the new intersection between the two, wherever that may be.
If the price charged in a market is below equilibrium, supply and demand are not equal. There will be either excess demand or excess supply. Excess demand is where demand is greater than supply, and there are shortages in the market. Excess supply is where supply is greater than demand and there are unsold goods in the market. With disequilibrium in the market, producers must change the price of products (if there is excess demand) or adjust supply (if there is excess supply).
Price Elasticity of Demand:
For some goods, price changes mean that there are large changes in the quantity demanded, and for others, there will be a smaller change. For a large change, you say that demand is much more responsive to price. Price Elasticity of Demand (aka PED) is the responsiveness of demand to a change in price.
Inelastic Demand is where the change in price results in a proportionality smaller change in the quantity demanded. Elastic demand is where the change in price results in a greater change in quantity demanded.
The formula to calculate PED is PED = (% change in quantity demanded)/(% change in price). There are a few different outcomes to this formula:
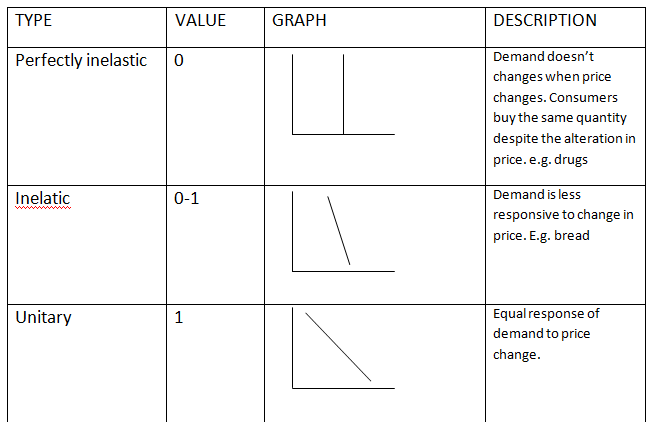
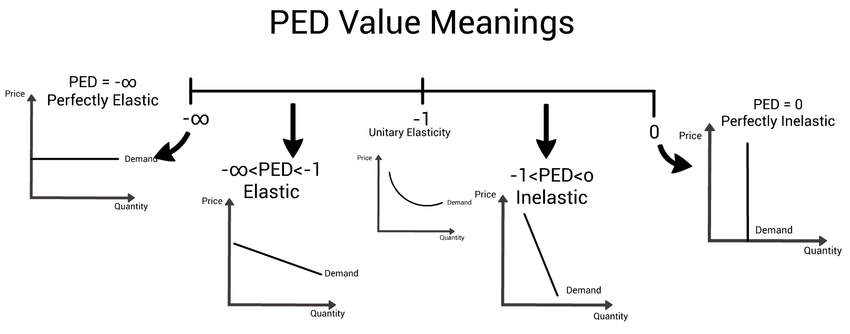
- If PED<1, demand is inelastic
- If PED>1, demand is elastic
- If PED=0, demand is perfectly inelastic
- If PED=∞, demand is perfectly elastic
- If PED=-1, demand is unitary elastic
Perfectly inelastic is where a change in price will result in no change in quantity demanded. Perfectly elastic is where an increase in price results in zero demand**. Unitary elastic** is where the responsiveness of demand is proportionately equal to a change in price.
The value of PED can be affected by these factors:
- Availability of substitutes - goods with many substitutes will have elastic demand because consumers can easily switch between products. If there are few/no substitutes, then there will be inelastic demand
- Degree of necessity - essential goods (ie rice, car fuel) will have inelastic demand because people need to buy them. Inessential goods (ie big-ticket luxury items) have elastic demand
- Habits - if a product is habit forming, then it may become necessary for consumers, giving it inelastic demand
- Proportion of income spent on a product - If consumers spend a large proportion of their income on a product, then demand becomes more elastic because consumers are more likely to wait for a price drop
- Time - In the short term, goods have inelastic demand as it takes consumers time to find substitutes when the price rises (for example). In the long run, demand is more elastic as consumers can spend more time searching for alternatives
When price changes, there is a change in quantity demand and therefore there is a change in total revenue. Price elasticity will tell us whether revenue rises or falls after price changes