RAM midterms
INTRODUCTION TO MODELING REQUIREMENTS DEFINITION
Models (2 perspective):
current or as-is - existing business process/es or information system
proposed or to-be - changes in the process/es or information system are visualized
Requirements result from:
- detection of problem areas
- explicitly stated requirements from stakeholders
- features that inherently arise from automation
- proper guidance and engagement with users so that they are able to specify their needs
- existing laws or policies
- other analysis strategies that enable the analyst to visualize the to-be system
Requirements definition/checklist:
- functional requirements - typical set of functions or services provided by a system or software
- non-functional requirements - quality characteristics that a system or software must meet; standards
Requirements examples:
- students must enter the required application data such as name, high school, and three program choices in order if priority
- the cashier must have the option to scan or input the barcode of an item
- the daily delivery routes for the couriers must be determined by the system based on the delivery schedule
Statement of Requirements:
- simple and unambiguous (clear and precise) manner to customers
- technical manner for the dev team
- more formal syntax that can be stored and processed by a CASE tool
**Requirements serve as basis for various levels of design, eventual integration, verification and validation; reference and a communication tool**
Requirements Document: Sample Template
Introduction
Description / Purpose
Scope
Definition of Terms
Current Process
Proposed Process
Functional Requirements
Non-functional Requirements
Assess the quality of requirements
- accuracy
- consistent
- any missed or errors (Murphy’s Law, Devil’s Advocate)
How is validation done?
- manual inspection
- presentations to stakeholders
- peer reviews / walkthroughs
- formal reviews
- the prototype
INTRODUCTION TO MODELING DATA FLOW DIAGRAMS
DATA → INFORMATION SYSTEM → INFORMATION
DATA → INFORMATION SYSTEM → INFORMATION → ANOTHER INFORMATION SYSTEM → INFORMATION
What information is generated?
- admission module
- vaccination monitoring process
- sales system
- grading system
Data Flow Diagram (DFD)
- graphical tool that shows how data moves through an information system, the relationship among the data flows and how data gets to be stored at a specific location
- represents functions or processes which capture, manipulate, store and distribute data between a system and its environment and between components within a system
- shows what a system does
- shows the system components and its boundaries
- provides information
- can depict business rules
- does not intend to provide information about timing, sequence or synchronization
DFD Components / Elements
Process Symbol
- receives input data and produces output
- levels of detail or complexity
- “black box” - viewed in terms of its inputs and outputs; user does not need to know how it works nor who are involved in the process
- appropriate action verb-object pair
External Entity
- represents the source of data coming into the system or destination (sink) of data leaving the system
- it may be a person, org., unit, device or another app / system
Data Store
- logical representation of data that the system stores
- data at rest waiting to be used by a process
- most reporting / viewing features
Data Flow Symbol
- represents one or more data items
- arrow - movement
- label must be a noun or an adjective-noun phrase
Notations
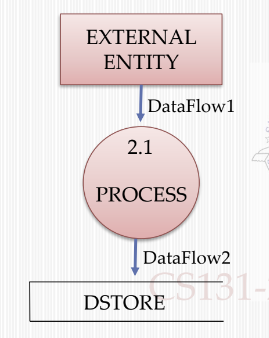
- Gane & Sarson Model
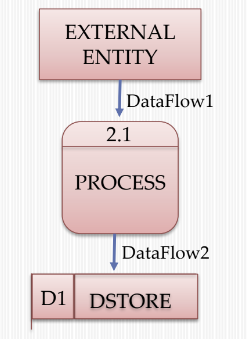
- Yourdon & Coad / deMarco Model
DFD Construction
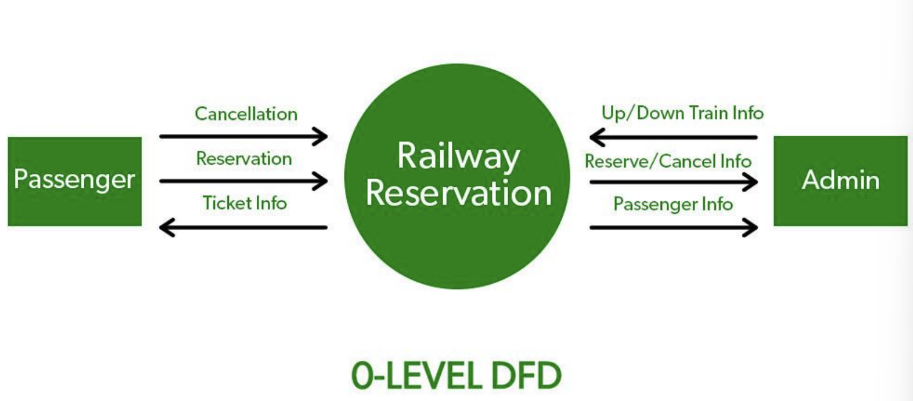
Step 1: draw a Context Diagram
- overall business process as just ONE process
- does not follow naming convention - it is typically a noun that represents the name of the process / information system
- show all the external entities
Functional Decomposition
- single process may need to be broken down into smaller processes
- FD / Explosion / Levelling - process of creating hierarchy of DFDs and a process in the parent DFD is represented in more detail in a child DFD
- process that cannot be decomposed referred to as a primitive process
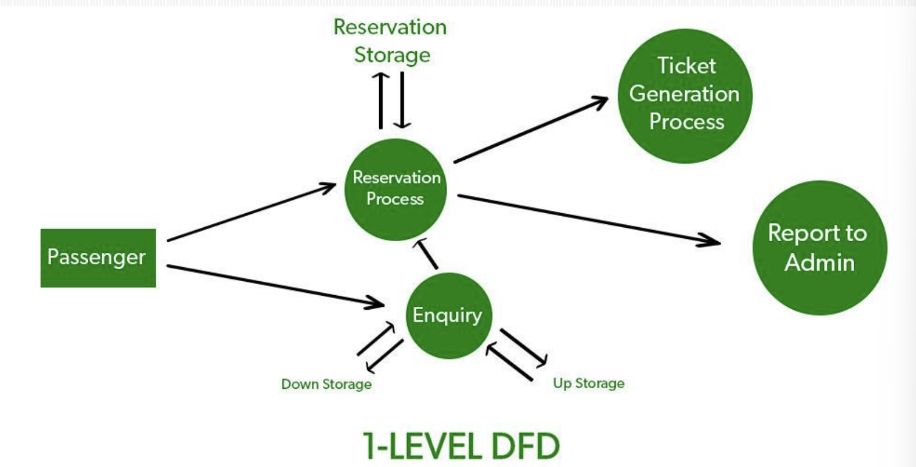
Step 2: draw the Top=Level Diagram / Level 1
- Level 1 - the function decomposition of Process 0 - it shows all the major processes that overall system
- major processes are interrelated by data flows
- show external entities
- shows the system-wide data stores
- numbered 1,2,…, and so on
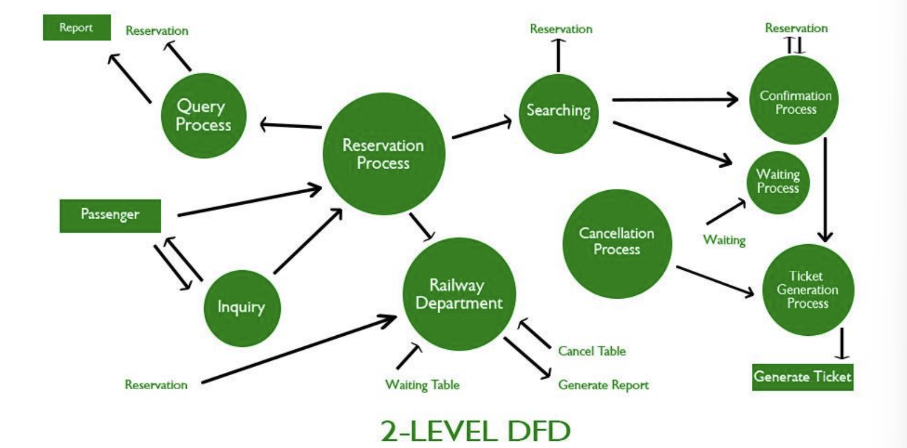
Step 3: draw the Lower-level DFDs (level 2)
- shows all the internal processes
- if a parent process is decomposed into three child processes, these child processes wholly and completely make up the parent process (1 → 1.1, 1.2, 1.3)
- only non-primitive processes need to be decomposed
Step 4: continue with the decomposition
- if further decomposition is needed
Balanced DFDs
- the input and output flows in any higher level DFD must be maintained in its decomposition or explosion
Other Guidelines:
- separate pages for each DFD
- use unique names (each set of symbol)
- provide reference number for each processes
- data stores reference numbers → D1, D2, D3…
- no crossing of lines
- DFD should be balanced
- observe conservation of data
- drawing DFDs is an iterative task
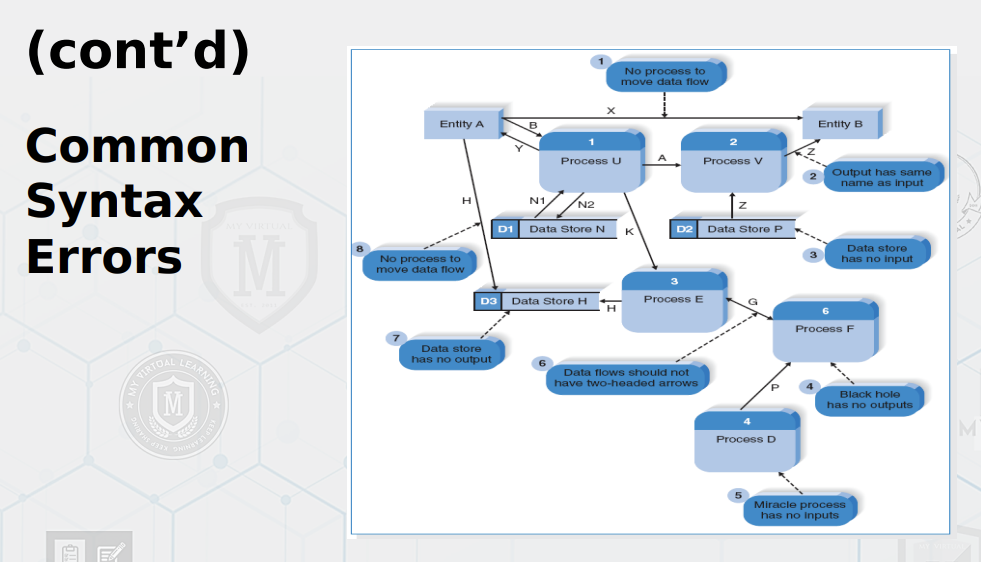
- at least ONE incoming flow and at lease ONE outgoing flow (no spontaneous generation, black hole phenomenon)
- accessing data flow: can retrieve / use, can add new data or update / remove existing data
- data flow rules (no between data store, external entity, recursive data)
- ONE direction between symbols (bidirectional flows are allowed when one is dependent on the other (e.g., question&answer), but these can be shown as separate flows)
- sufficient to generate (no gray hole phenomenon)
Diverging Data Flow
- splits into multiple flows
- data may be routed to PARALLEL processes or multiple instances of the same output goes to separate destinations
Converging Data Flow
- merges multiple data flows into a single packet for subsequent processing
Composite Data Flow
- consists of 2 or more data flows
Processes - can be described in further detail through process descriptions (simple textual descriptions, more formal techniques: flowcharts, structured english, decision trees, decision tables)
OTHER MODELING TECHNIQUES USE CASES
Ivar Jacobson - Researcher of Software Engineering
James Rumbaugh - Researcher of Human-Computer Interaction
Grady Booch - Software Engineer
Unified Modeling Language (UML) - products of object-oriented development that provides a standard set of diagrams used to visually represent a system
Use Case Literature
- Alistair Cockburn ("Co-burn”) - an American Computer Scientist
- Martin Fowler and others consider his ideas as a primary source on use case modeling
Use Case Narrative
- written description of a user’s interaction with the system that is initiated by the actor
Use Case Diagram
- high level view of these use cases
Schemes
- casual / informal vs rigorous / formal
- no standard format
Casual Use Case
- Title (verb-goal phrase) (ex. Withdraw Cash)
- Actor (ex. Student)
- Scope (ex. Student withdraw cash at the ATM)
- Level of detail (ex. User Goal)
- Informal description of what happens (ex. The student inserts the ATM card to the ATM, enters password, withdraws cash, retrieves ATM card.
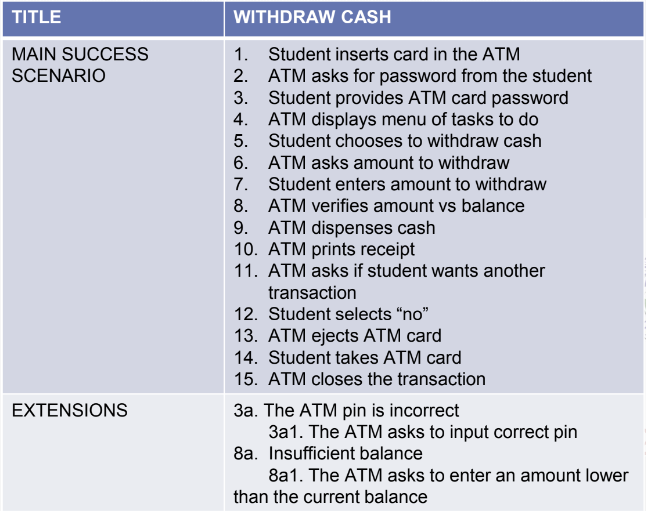
Casual Use Case (Fowler)
- Title (verb-goal phrase)
- Main Success Scenario
- Extensions
Detailed Use Case
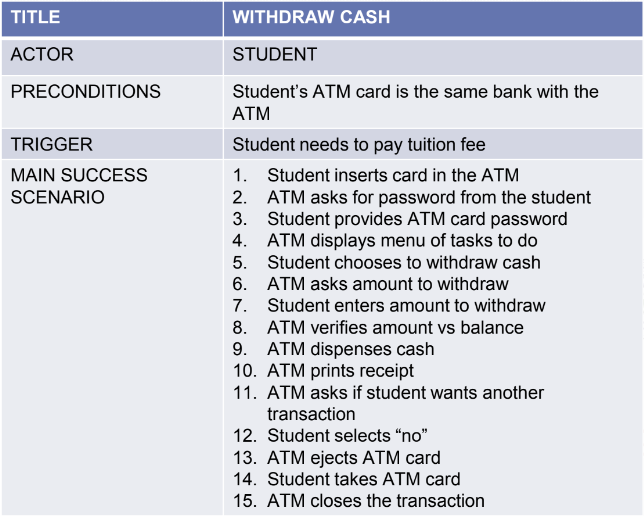
- Title / Name
- Actor
- Preconditions
- Trigger
- Main Success scenario / Basic Flow / Basic
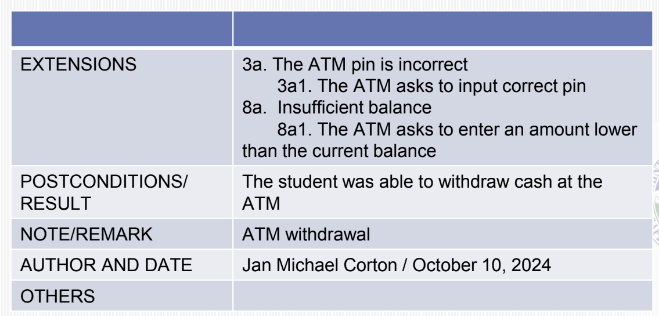
- Extensions
- Postconditions / Result
- Notes / Remarks
- Author and Date
Success and Failure Scenarios
Scenario - specify a specific sequence of actions and interactions between actors and the system
Main Success Scenario / Basic Flow
- main path that the use case will take to reach a successful state; if-then situations are omitted
- up to 12 steps
- some steps may refer to a separate use case - the name of the use case is used instead
Preconditions
- expected to be true when use case begins
- when a use case can be triggered even if an expected system state is not necessarily satisfied, this state must NOT be a precondition
- set in the system, not outside of it
Triggers
- events that initiate a use case
Extensions
- used to represent if-then scenarios in the main use case
- may be exceptions or alternates
- continues or terminated
- if it consist of multiple steps, the extension will use the name of the new use case instead
- indicate only conditions that can be detected by the system
- some extensions can be TRIGGERED at any point in the main success scenario
**USE CASE DIAGRAM serves as a context diagram and a graphical table of contents of all use cases**
Actor
Primary Actor
- initiates the use case and interacts with the system
Secondary Actor
- does not interact with the system but helps in the achievement of the goal
Includes
- relationship between two cases - base and included
- occurs when a set of steps in the main success scenario is separated into another use case
Generalization / Specialization
- a child use case inherits the behavior of the parent use case
Extends
- relationship between two cases (base, extending use case)
DFD QUALITY CHECKLIST
Process
- always has a unique name that is an action-oriented verb phrase, a number and a description
- AT LEAST one input data flow
- AT LEAST one output data flow
- output data flows have a different name than input data flows
- can receive input data and produces output that has a different content, form, or both
Top-Level: 4-7 processes
Lower levels: 2-5 processes
Data Flow
- always has a unique name (NOUN) and description (data dictionary)
- it connects to at least a process, a entity or a data store
- one direction only (no two headed arrows)
- no crossing of data flow
Data Store
- every data store has a unique name (NOUN / all caps) and a description (data dictionary)
- AT LEAST one input data flow (add, update, delete)
- AT LEAST one output data flow (retrieve)
- physical characteristics are not important, we are concerned only with logical model
External Entity
- always has a unique name (NOUN) and description
- AT LEAST one output data flow
- AT LEAST one input data flow
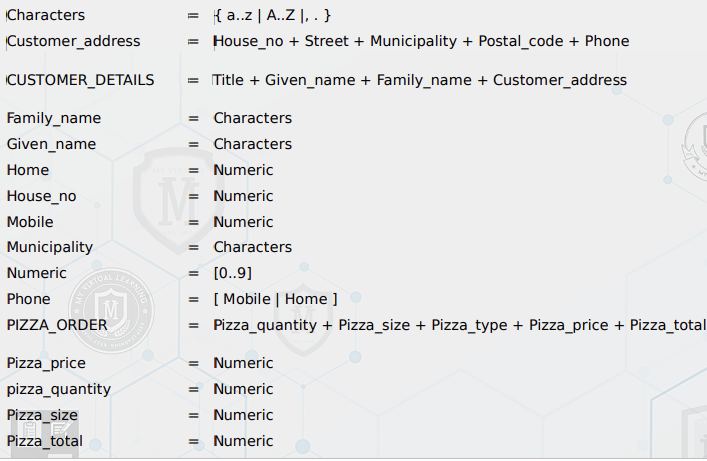
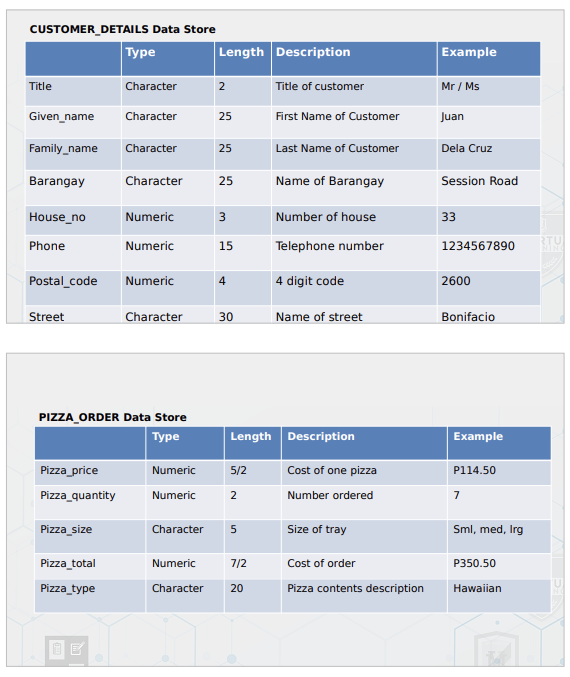
Data Dictionary
- data repository
- a central storehouse of information about the system’s data
- an analyst uses the data dictionary to collect, document, and organize specific facts about the system
- also defines and describes all data elements and meaningful combinations of data elements
- data element - “data item or field” is the smallest piece of data that has meaning
- record - is a meaningful combination of related data elements that is included in a data flow or retained in a data store
Documenting the Data Elements
- attributes that are recorded and described: source, security, responsible user(s), description and comments
Documenting the Data Flow
- attributes: data flow name or label, description, alternate name(s), origin, destination, record, volume and frequency
Documenting the Data Stores
- characteristics: data store name or label, description, alternate name(s), attributes, volume and frequency
Documenting the Processes
- characteristics: process name or label, description, process number, process description
Documenting the Entities
- characteristics: entity name, description, alternate name(s), input and output data flows
Data Dictionary Reports
- alphabetized list of all data elements by name
- describing each data element and indicating the user or department that is responsible for data entry, updating, or deletion
- a report of all data flows and data stores that use a particular data element
- detailed reports showing all characteristics of data elements, etc.
PROCESS MODELING
Process Model
- can be used to further clarify the requirements definition and use cases
- a graphical way of representing how a business system should operate
- can be used to document the as-is system or the to-be system, whether computerized
Data flow diagramming - is a technique that diagrams the business processes and the data that pass among them.
Logical process models - describe processes without suggesting how they are conducted.
Physical process models - provide information that is needed to build the system.
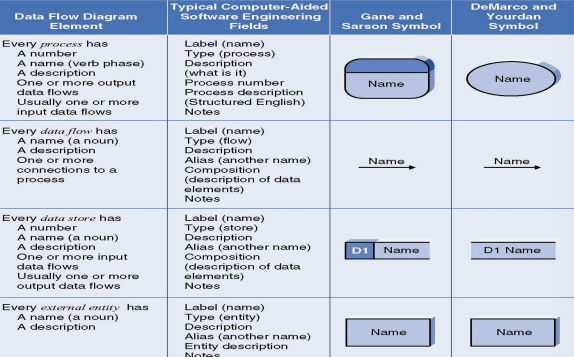
ELEMENTS OF DATA FLOW DIAGRAMS
Process – A process is an activity or a function performed for some specific business reason.
Data Flow – A data flow is a single piece of data, or a logical collection of several pieces of information.
Data Store – A data store is a collection of data that is stored in some way.
External Entity – An external entity is a person, organization, organization unit, or system that is external to the system, but interacts with it.
Using DFDs to Define Business Processes
- Business processes are too complex to be explained in one DFD.
- One important principle in process modeling with DFDs is the decomposition of the business process into a series of DFDs, each representing a lower level of detail.
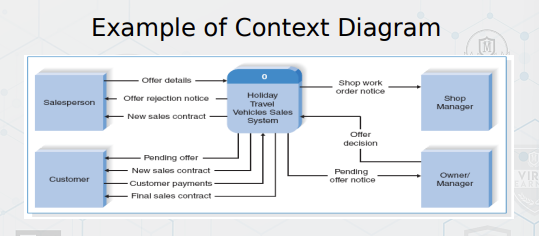
Context Diagram
- the first DFD in every business process
- It shows the entire system in context with its environment.
- The context diagram shows the overall business process as just one process and shows the data flows to and from external entities.
Level 0 Diagram
- shows all the major high-level processes of the system and how they are interrelated.
- shows all the processes at the first level the numbering, the data stores, external entities, and data flows among them.
- A key concept: Balancing - Ensuring that all information presented in a DFD at one level is accurately represented in the next-level DFD.
- A process model has one and only one level 0 DFD.
Level 1 Diagram
- Each process on the level 0 DFD can be decomposed into a more explicit DFD called level 1 diagram (or level 1 DFD).
- The set of children and the parent are identical; they are simply different ways of looking at the same thing.
- It is important to ensure that level 0 and level 1 DFDs are balanced.
- All process models have as many level 1 diagrams as there are processes on the level 0 diagram.
- The parent process and the children processes are numbered consistently
Level 2 Diagram
- shows all processes, data flows, and data stores that comprise a single process on the level 1 diagram.
- It is important to ensure that level 1 and level 2 DFDs are balanced.
Alternative Data Flows
- A process can produce different data flows under different circumstance.
- We show both data flows and use the process description to explain why they are alternatives
Process Descriptions
- The purpose of the process descriptions is to explain what the process does and provide additional information that the DFD does not provide.
- Three techniques are commonly used to describe more complex processing logic: Structured English, Decision trees, Decision tables
Creating Data Flow Diagrams
- DFDs start with the information in the use cases and the requirements definition.
- Generally, the set of DFDs integrates the individual use cases.
-The project team takes the use cases and rewrites them as DFDs, following the DFD formal rules about symbols and syntax.
- CASE tools are used to draw process models.
1. Build the context diagram.
2. Create DFD fragments for each use case.
3. Organize the DFD fragments into level 0 diagram.
4. Develop level 1 DFDs based on the steps with each use case. In some cases, these level 1 DFDs are further decomposed into level 2 DFDs, level 3 DFDs., and so son.
5. Validate the set of DFDs to make sure that they are complete and correct.
Creating the Context Diagram
- The context diagram defines how the business process or computer system interacts with its environment.
- Draw one process symbol for the business process or system being modeled (numbered 0 and named for the process or system).
- Add all inputs and outputs listed on the form of the use cases as data flows.
- Draw in external entities as the source or destination of the data flows.
- No data stores are included in the context diagram.
Creating DFD Fragments
- A DFD fragment is one part of a DFD that eventually will be combined with other DFD fragments to form a DFD.
- Each use case is converted into one DFD fragment using the information given on the form of the use case: the name, the ID number, and major inputs and outputs.
- The information about the major steps that make up each use case is ignored at this point; it will be used in a later step.
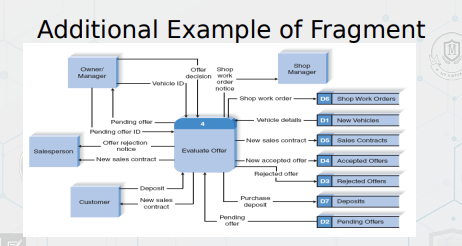
- Important changes are often made in converting the use case into a DFD:
- modifications to the process names
- the addition of data flows.
- Make sure that any information given to the user is obtained from a data store.
- There are not formal rules covering the layouts; typically
– place the processes in the middle
– inputs start from the left or top
– outputs leave from the right or the bottom
– place data stores below the processes
Creating the Level 0 Diagram
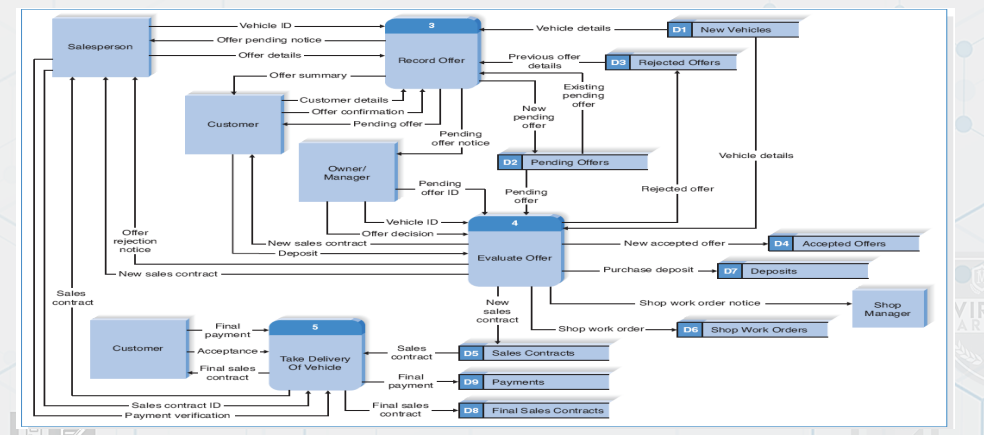
- Combine the set of DFD fragments into one diagram – the level 0 DFD.
- There are not formal layout rules. Generally,
- to put the process that is first chronologically in the upper-left corner and work the way from top to bottom, left to right;
- to reduce the number of crossed data flow lines.
- Iteration is the cornerstone of good DFD design.
Creating Level 1 Data Flow Diagrams
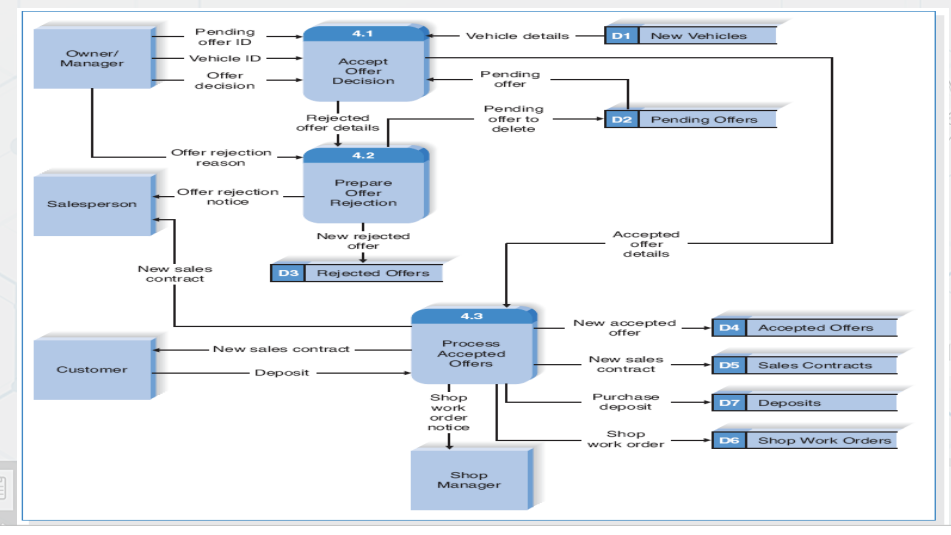
- Level 1 DFD – lower-level DFDs for each process in the level 0 DFD.
- Each one of the use cases is turned into its own DFD
- Each major step in the use case becomes a process on the level 1 DFD, with the inputs and outputs becoming the input and output data flows.
- Level 1 DFDs include the sources and destinations of data flows for data stores and data flows to processes.
- Including external entities in level 1 and lower DFDs can simplify the readability of DFDs.
- There is no simple answer to the “ideal” level of decomposition, because it depends on the complexity of the system or business process being modeled.
- In general, you decompose a process into a lower-level DFD whenever the process is sufficiently complex that additional decomposition can help explain the process.
- Rules of thumb:
- There should be at least 3, and no more than 7-9, processes on every DFD.
- Decompose until you can provide a detailed description of the process in no more than 1 page of process descriptions.
Validating the DFD
There two fundamental types of errors in DFDs:
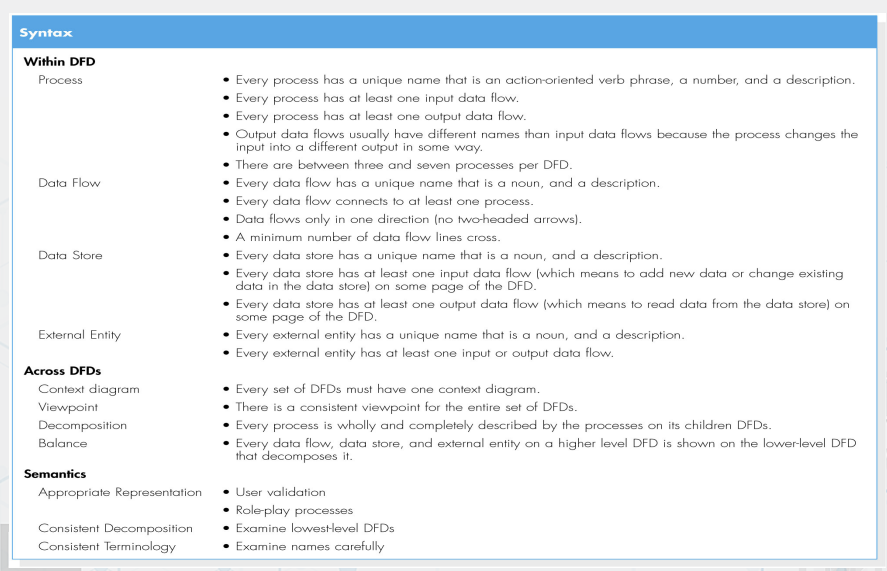
1. Syntax errors – can be thought of as grammatical errors that violate the rules of the DFD language.
2. Semantics errors – can be thought of as misunderstandings by the analyst in collecting, analyzing, and reporting information about the system.
- Syntax errors are easier to find and fix than are semantics errors because there are clear rules that can be used to identify them.
- Most CASE tools have syntax checkers that will detect syntax errors.
- Semantics errors cause the most problems in system development.
- Three useful checks to help ensure that models are semantically correct:
1. to ensure that the model is an appropriate representation by asking the users to validate the model in a walk-through
2. to ensure consistent decomposition
3. to ensure that the terminology is consistent throughout the model
Summary
- Data Flow Diagram Syntax – four symbols are used on data flow diagrams (processes, data flows, data stores, and external entities).
- Creating Data Flow Diagrams
- The DFDs are created from use cases.
- Every set of DFDs starts with a context diagram.
- DFDs segments are created for each use case, and are then organized into a level 0 DFD.
- Level 1 DFDs are developed on the basis of the steps within each use case.
- The set of DFDs are validated to make sure that they are complete and correct and contain no syntax or semantics errors.