Standard deviation and T test
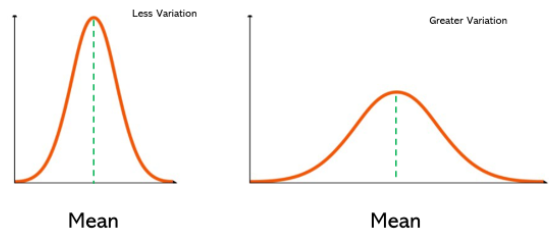
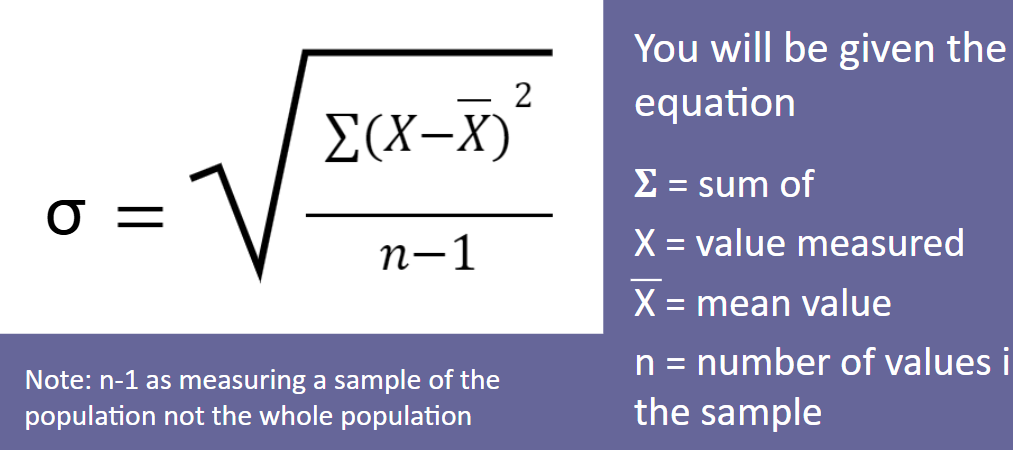
Standard deviation
a measure of how spread out the data is
the more spread out the data the more variation that exists
represented by sigma symbol
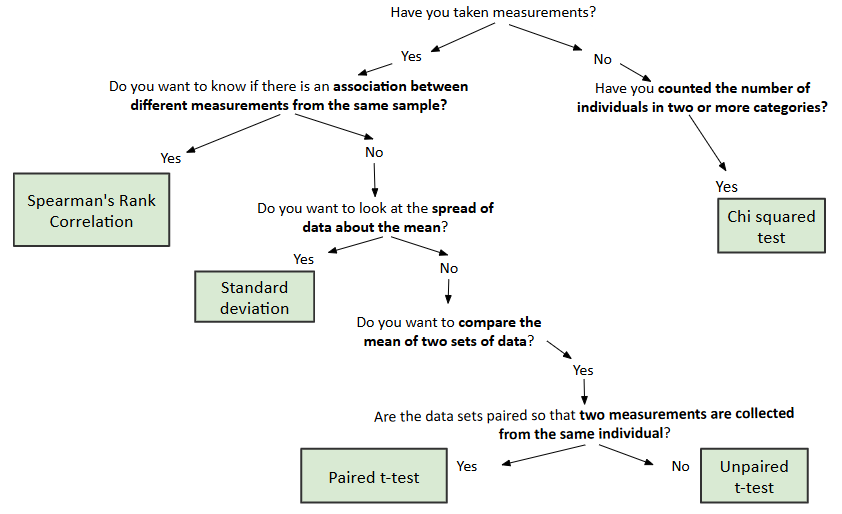
Statistical tests
can be used to give a likelihood of any variation in the data being statistically significant
not just due to normally occurring variation in the data
we use a p value of 0.05
means there is only a 5% chance that our conclusion is wrong
95% sure we are correct
Carrying out a statistical test
state null hypothesis
calculate test statistic
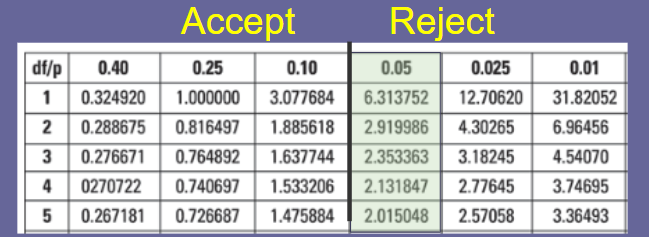
compare this to a table of probability values
accept/reject null hypothesis
state clear conclusion
Null hypothesis
prediction that there is no significant difference between the groups/populations being studied
any observed difference is thus chance
part of normal variation seen in any population
p values
used to determine how likely it is that the observed outcome is due to natural variation
if the calculated statistical value is less than the critical value for p=0.05 then we accept the null hypothesis
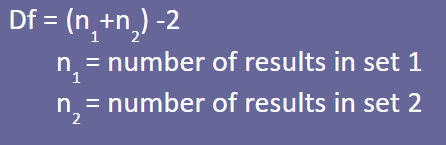
Degrees of freedom
greater number of data points = greater the potential spread of results
it is necessary to take into account the potential spread of results by calculating the degrees of freedom
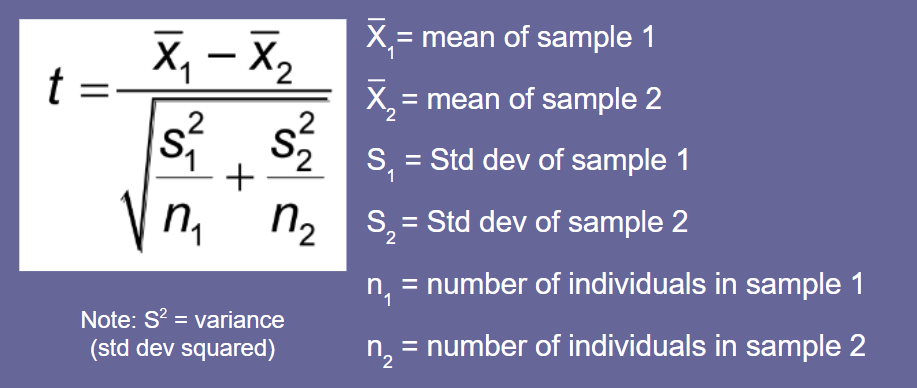
unpaired t test:
Unpaired t test
data collected should be:
normally distributed
enough to calculate a reliable mean
approx n = 15
the two groups can have different sample sizes