wk5 IRM - nonparametric data test
Nonparametric alternatives in IRM: Spearman correlation and Wilcoxon test
Use non-parametric test when normality assumptions are violated (e.g., data are not normal or there are outliers you don’t want to remove).
Parametric tests generally have more statistical power, but nonparametric tests are important when assumptions don’t hold.
Nonparametric tests have very few or sometimes no assumptions, making them very flexible.
Spearman correlation
Spearman correlation is an alternative to Pearson when data is nonparametric
Spearman is denoted as or rho (p)
Assumptions for spearman correlations are:
At least one variable needs to be continuous; the other can be continuous or dichotomous.
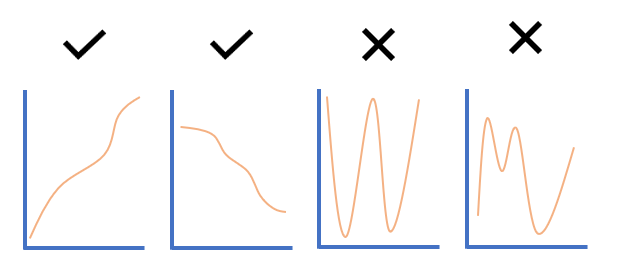
The relationship between the two variables should be monotonic, not necessarily linear.
Monotonic means the relationship consistently increases or decreases
It can plateau; the rate of incline/decline can change but the trend must be consistently up or down.
Visualize monotonicity with a scatter plot
What Spearman measures
It assesses the strength of a monotonic relationship between two variables.
Pearson correlation looks at the actual values of your data and measures a straight-line (linear) relationship.
Spearman correlation ignores the exact values and instead looks at the order or rank of the data — who’s first, second, third, etc. — and measures if the order is consistent between the two variables.
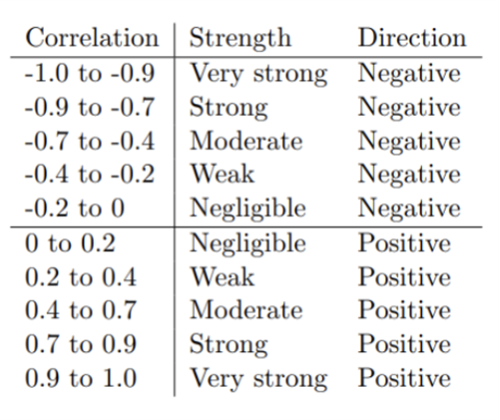
The coefficient can be interpreted using the same qualitative cutoffs as Pearson
It is an effect size measure, report just and a p-value
e.g. (38) = .34, p = .009

Wilcoxon tests (nonparametric alternative to t-tests)
Wilcoxon test comes in two forms, one-sample(within-subjects) and two-sample(between-subjects)
Wilcoxon tests can handle any type of dependent variable data in two-group comparisons when assumptions of parametric tests are not met
The Wilcoxon test for two groups is often referred to as the Mann–Whitney U Wilcoxon test.
Wilcoxon test statistic is denoted by W in reporting;
note that there is also a Shapiro–Wilk statistic denoted W in a different test, so be careful with context: "W" from Wilcoxon test vs "W" from Shapiro–Wilk test.
Reporting examples
w = 110, \, p < 0.001.

Quick mental model
Spearman: ranks data, tests monotonic association, robust to nonnormality.
Wilcoxon: compares distributions between two independent groups without assuming normality; provides a test statistic and p-value to determine if groups differ.