unit 1 exam
decisions in the social media age
imperfect decisions because we don’t have enough data
behavior in markets
1.1 intro to economics
economics: study of how humans make decisions in scarcity
scarcity: human wants for goods, services, and resources exceed availability
resources (labor, tools, land, raw materials, time) necessary to produce
the problem of scarcity
american west is in drought, diminishing water supplies
denver producing campaigns to popularize conservation
division and specialization of labor → production innovation by adam smith
division of labor: production of good or service divided into diff workers
why division of labor increases production
specialization: allows workers with advantage to focus on parts of production
efficiency & quality & innovation → assembly line
core competency: business that focuses on few products
economies of scale: as level of production increases, avg cost of producing individual unit decreases (machinery, specialization, etc)
trade and markets
specialization requires trade (workers get paid for the work they do)
why study economics?
every major global issue (cc, poverty, political conflicts) is economic
economics critical to public policy (voting on budges, regulations)
1.2 micro and macro
microeconomics: individual agents within the economy (households, workers, businesses)
macroeconomics: economy as a whole & broad issues (growth of production, unemployment, inflation, government deficits, GDP)
micro decisions of businesses influenced by health of macroeconomy
firms more likely to hire workers when economy is growing
microeconomics
budgets of households & individuals
goods & services that fit needs & wants of micro agents
decisions on working (fulltime? parttime?)
saving decisions
how do firms decide how to operate their business?
macroeconomics
level of economic activity in society
goals: growth in standard of living, low unemployment/inflation
monetary policy: central bank’s policies that affect bank lending, interest rates, financial capital markets
fiscal policy: nations’s legislative body that involves government spending and taxes
1.3 theories and models
keynes (20th c): economics is a method of thinking
theory: simplified rep of how variables interact in an issue
model: applied/empirical rep to test theories
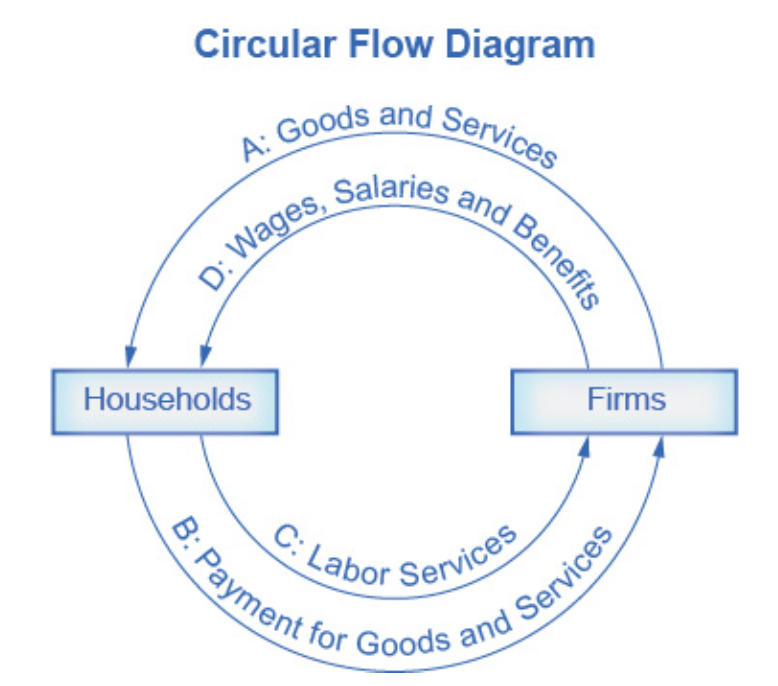
circular flow diagram: economy has households & firms in the goods and services market (firms sell, households buy) and labor market (households sell, firms buy)
labor and resources: land, capital, raw materials
1.4 economic systems
traditional economy: oldest economic system, little development, occupations in family, produce what you consume.
command economy: ruler/government determines what goods/services are produced and their prices. decides methods of production & wages for workers. provides necessities (healthcare + education). cuba & noko.
market economy: decentralized decision-making.
market: institution that brings together buyers & sellers of goods/services. new york stock exchange.
private enterprise: private individuals own and operate means of production (resources & businesses).
most economies are mixed
regulations
protect private property, prevent violence/fraud, legal contracts, collect taxes
underground economies: black markets of highly regulated economies
the rise of globalization
globalization: expanding cultural, political, economic connections
increased buying & selling of goods, services, assets across borders
international trade & financial capital flows
causes
improvements in shipping (container/cargo ships)
lower transportation costs
innovations in computing & telecommunications for management & sales
international agreements & treaties for greater trade
exports: goods & services one produces domestically, sells abroad
imports: goods & services one produces abroad, sells domestically
gross domestic product: measure of size of total production in economy
exports/gdp: share of country’s total economic production sold overseas
US below global avg - keep division of labor inside borders
Smaller economies need to trade to take adv of division of labor, specialization, and economies of scale
pushback against globalization: loss of jobs, political sovereignty, increased economic inequality (brexit, trump election)
chapter 1 review
what is economics and why is it important?
solves the problem of scarcity
modern economy displays division of labor
agents focus on areas of advantage (natural factors, skill levels)
encourages agents to learn and invent
agents take advantage of economies of scale
division & specialization of labor only work when individuals can purchase what they don’t produce in markets
microeconomics & macroeconomics
different perspectives on the economy
microeconomic: parts of the economy (individuals, firms, industries)
macroeconomic: growth in standard of living, unemployment, inflation → monetary & fiscal policy
how economists use theories & models to understand economic issues
theory isn’t an illustration of the answer to a problem
theory is a tool for determining the answer
how to organize economies: overview of economic systems
traditional, command, market-oriented economies
most societies are a mix
globalization evolves as a result of growth in commercial & financial networks
makes businesses and workers from different economies interdependent
2.1 choices & budget constraint
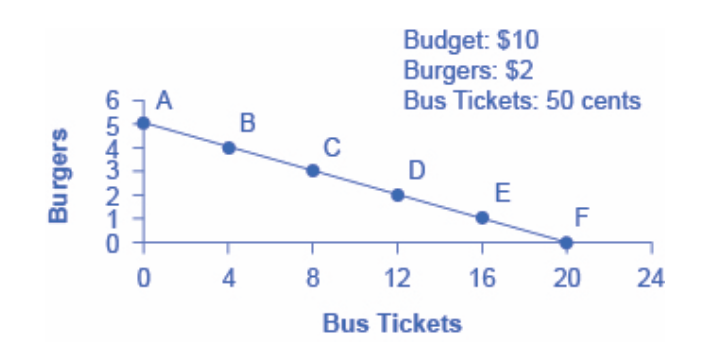
consumption choice opportunity frontier: relative price of burgers and bus tickets determines slope of budget constraint
opportunity cost: what one must give up to obtain what is desired
cost of one item is lost opportunity to consume something else, value of next best alternative
budget = P_1 \times Q_1 + P_2 \times Q_2
P and Q are price and quantity of items purchased
budget is amount of income available to be spent
slope is the opportunity cost of good on horizontal axis
identifying opportunity cost
opportunity cost = price
marginal decision-making & diminishing marginal utility
marginal analysis: examining benefits & costs of choosing a little more or less of a good, change analysis
utility: satisfaction that goods and services desired provides
the more of some good one consumes, the more utility one obtains
law of diminishing marginal utility: as a person receives more of a good, the additional (marginal) utility from each additional unit of the good declines
a rational consumer will only purchase additional units of some product as long as the marginal utility exceeds opportunity cost
sunk costs
sunk costs: costs that were incurred in the past and cannot be recovered, shouldn’t affect current decision
focus on marginal costs and benefits of current/future options
from a model with two goods to one of many goods
budget constraint diagram with two goods isn’t realistic
modern economy: thousands of goods
draw multiple budget constraints
show possible tradeoffs between many pairs
2.2 production possibilities frontier
production possibilities frontier (ppf): model that explains the constraints society faces
limited resources (labor, land, capital, raw materials)
limit to quantities of goods and services it can produce
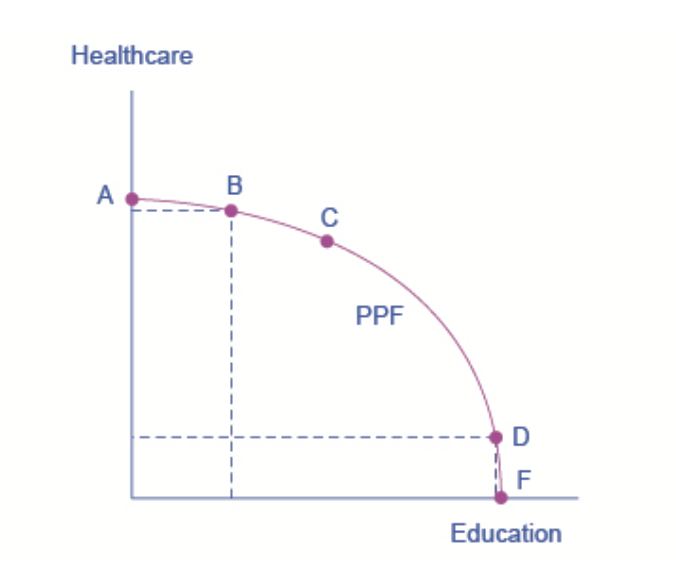
slope: opportunity cost
differences between budget cost & ppf
budget constraint is straight line
slope is relative prices of two goods
pov of individual consumer is fixed
ppf has curved shape bc of law of diminishing returns
ppf has no numbers bc no exact # of resources
the shape of the ppf and law of diminishing returns
consumption budget constraint: relative prices of two goods determines slope of budget constraint
law of diminishing returns: additional increments of resources are added to a certain purpose, marginal benefit from additional increments will decline
productive efficiency and allocative efficiency
economics doesn’t tell society what choices it should make
in market-oriented economy w democratic government, choices made from decisions of individuals, firms, government
efficiency: lack of waste
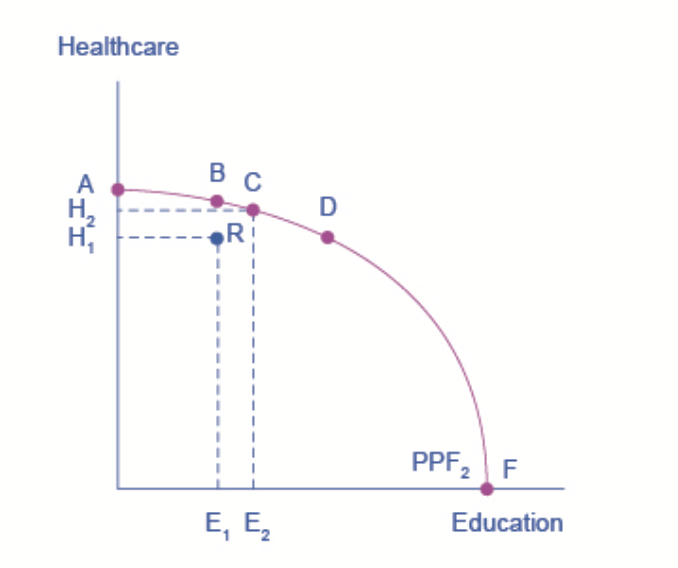
productive efficiency: given available inputs & tech, it’s impossible to produce more of good without decreasing quantity produced of another good
allocative efficiency: particular combination of goods & services on production possibility curve that society produces = combination that society desires
producers supply quantity of each product consumers demand
why society must choose
as resources grow (more labor, capital), economy grows
ppc shifts outwards
government tradeoffs
market economy coordinates process in which firms seek to produce goods and services in the quantity, quality, price that people want
ppf and comparative advantage
countries tend to have different opportunity costs of producing
climates, geography, tech, skills
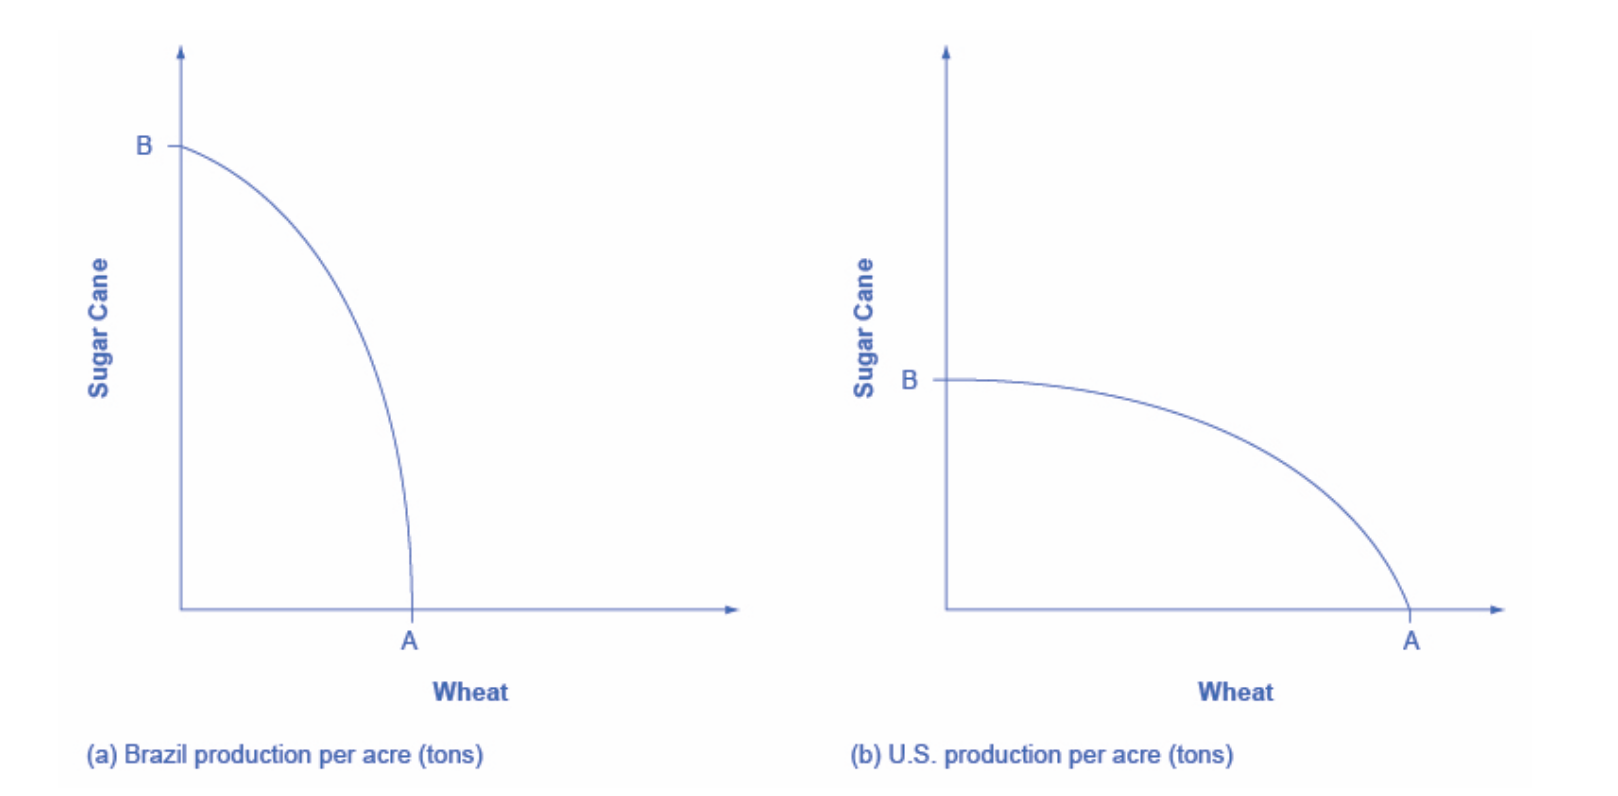
US PPF flatter = opportunity cost of wheat lower in the US
comparative advantage: country can produce a good at a lower opportunity cost than another country
international trade: countries’ differences in comparative advantage determine which goods they’ll produce and trade
manufacturers produce goods where opportunity cost is lowest, total production increases
2.3 objections to econ approach
first objection: people, firms, society don’t act like this
economic approach requires information & decision-making
maximizing utility? PPFs analysis? no.
approximation through economic analysis
second objection: people, firms, society shouldn’t act like this
self-interest isn’t moral
positive statements: describes world as it is
normative statements: how the world should be
freedom about economic choices
self-interested behavior → positive social results
economic output
invisible hand: consumers encourage businesses to offer goods and services to meet their needs
diagrams
consumption budget constraint = production possibilities frontier
tradeoff diagram illustrates scarcity, tradeoffs, econ efficiency
tradeoff: determined by relative prices of good
chapter 2 review
2.1 how individuals make choices based on their budget constraint
economic behavior involves tradeoffs in which individuals, firms, society forgo something they desire to obtain more desired
budget constraint (frontier of opportunity set) illustrates choices
relative price of choices determines slope of budget constraint
opportunity cost measures cost by what we forgo in exchange
economic decisions involve marginal analysis
law of diminishing marginal utility = more is less
sunk costs should be disregarded in making current decisions
2.2 production possibilities frontier and social choices
set of choices society faces for combination of goods and services
shape of ppf curved outward, not straight
all choices along ppf display productive efficiency (society’s resources to produce more of one good w/o decreasing production)
curvature differs by country, comparative advantage in diff goods
2.3 confronting objections to the economic approach
useful approach to understanding human behavior
positive vs normative statements & analysis
3.1 demand, supply, equilibrium
demand for goods and services
demand: amount of some good or services consumers are willing and able to purchase at each price
needs, wants, ability to pay
price: what buyer pays for a unit of specific good/service
quantity demanded: total # units consumers purchase at price
rise in price decreases quantity demanded
law of demand: inverse relationship
demand schedule: table that shows quantity demanded at each price
demand curve: relationship between price and quantity demanded on a graph, quantity horizontal axis, price per gallon vertical axis
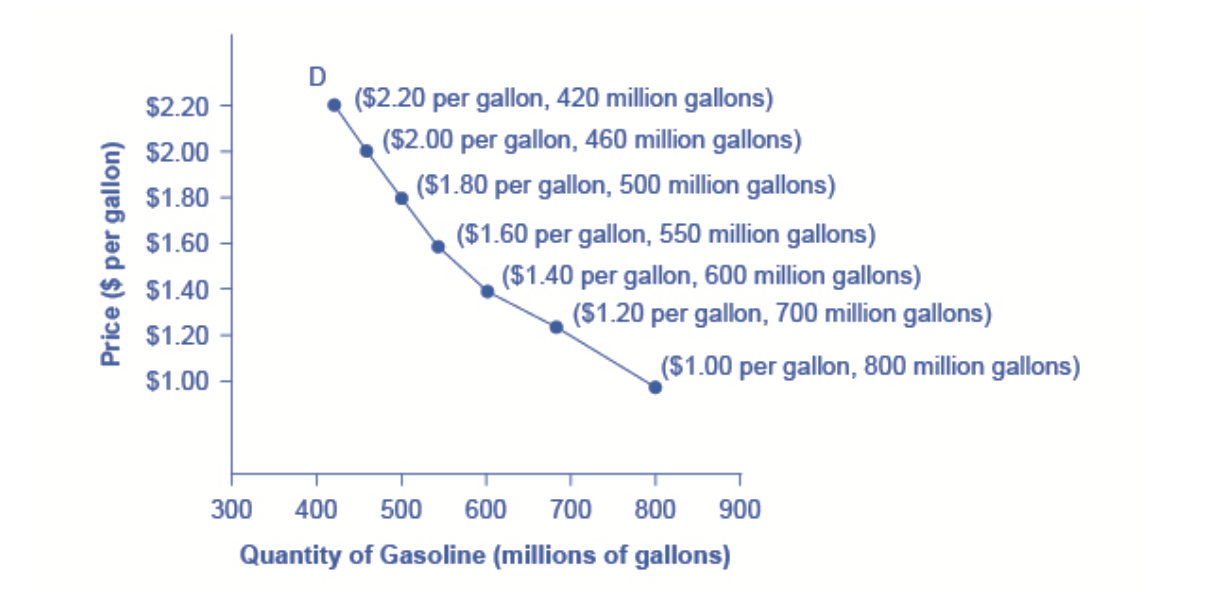
demand curves slope down from left to right
law of demand: price increase, quantity demanded decrease
demand ≠ quantity demanded
demand: relationship b/w range of prices and quantities demanded at those prices (demand curve/schedule)
quantity demanded: point on demand curve
supply of goods and services
supply: amount of some good or service producer is willing to supply at each price
price: what producer receives for selling one unit
quantity supplied: rise in price causes increase
law of supply: positive relationship between price and quantity supplied
supply schedule: table that shows quantity supplied at different range of prices
supply curve: graph of relationship between price & quantity
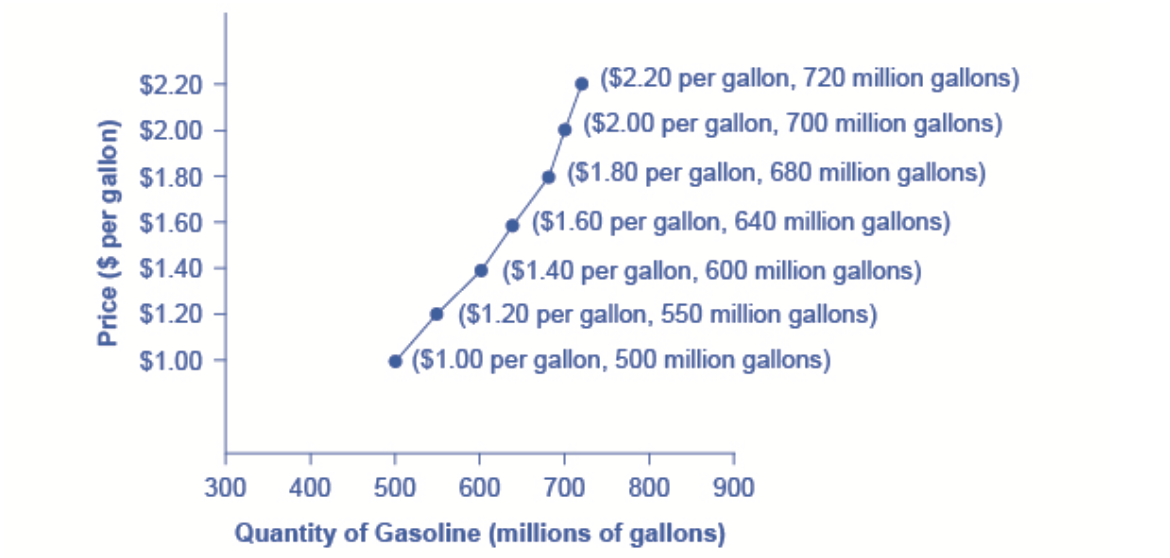
supply curves slope up from left to right (law of supply)
equilibrium - where demand and supply intersect
demand & supply determine price & quantity bought & sold in markets
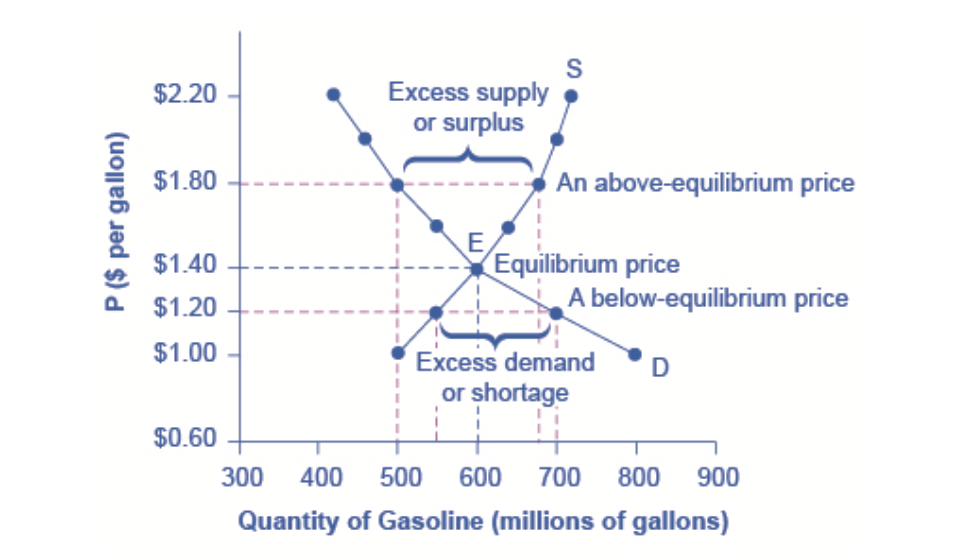
equilibrium price: only price where plans of consumers and plans of producers agree
equilibrium quantity: amt product consumers want to buy (quantity demanded) = amt producers want to sell (quantity supplied)
economic pressures move market toward equilibrium
excess supply (surplus): quantity supplied > quantity demanded
excess demand (shortage): quantity demanded > quantity supplied
3.2 shifts in s&d
what factors affect demand?
price
willingness to purchase (tastes & preferences)
ability to purchase (income)
prices of related goods
size or composition of population (demographics)
the ceteris paribus assumption
ceteris paribus: “other things being equal”
s&d curve with all other factors held equal
all other variables constant
how does income affect demand?
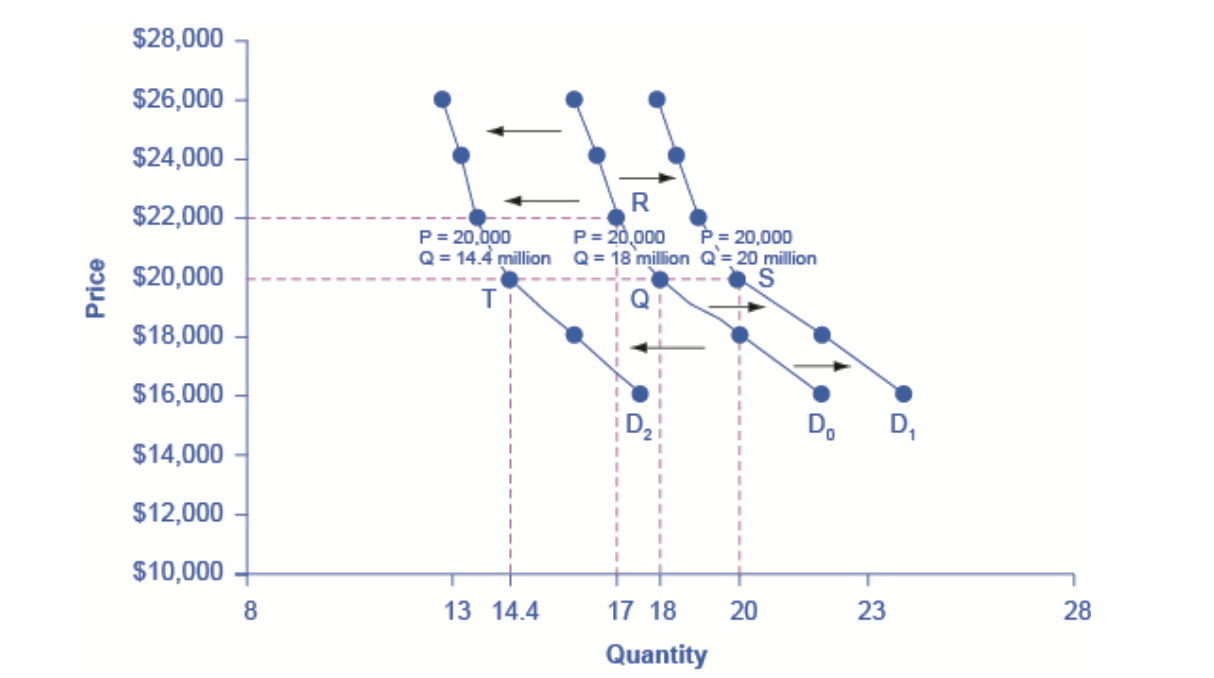
D0 shows initial demand
quantity demanded increases to point S with higher incomes
demand curve shifts to D1
D0 → D2 is decrease in demand due to slowdown in econ
shift in demand curve captures pattern for market as a whole
normal good: product whose demand rises when income rises
inferior good: product whose demand falls when income rises
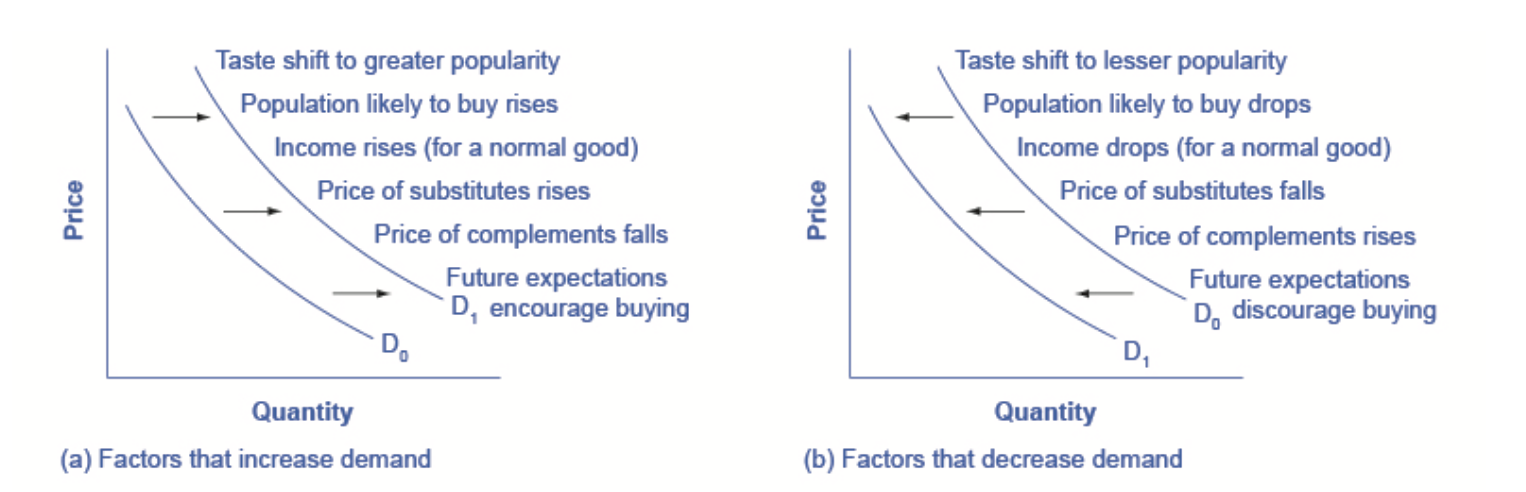
other factors that shift demand curves
changing tastes or preferences: change quantity of good demanded at every price (shift demand curve)
changes in composition of population: shift in demand curve
substitute: good/service that we can use in place of another good/service
complement: goods that are used together
changes in expectations: about future price (or expectations about tastes and preferences, income, etc.)
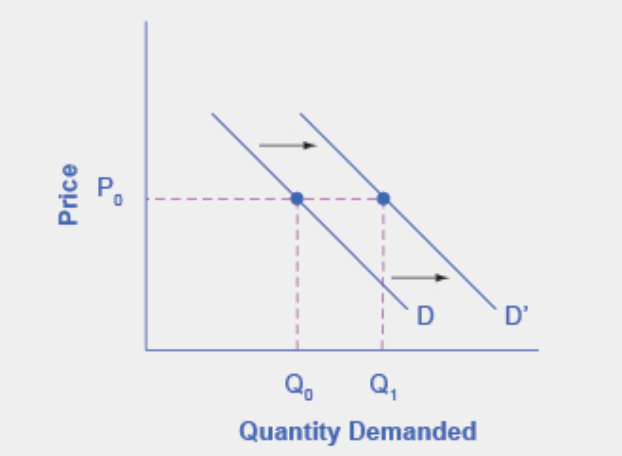
shift in demand: happens when a change in some economic factor (other than price) causes different quantity to be demanded at every price
summing up factors that change demand
how production costs affect supply
shift in supply: change in quantity supplied at every price
inputs/factors of production: firm produces goods and services using combinations of labor, materials, and machinery
lower costs of production, prices unchanged, profits up, supply up, so supply curve shifts to the right
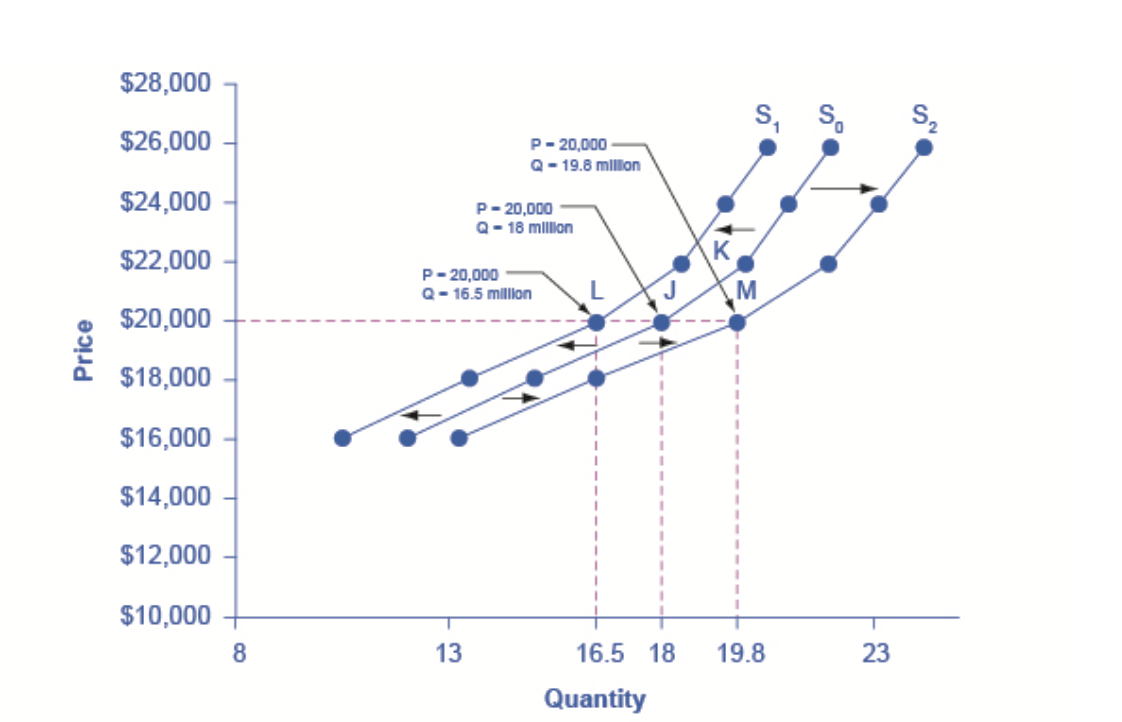
S0 → S1 : decreased supply (bc steel price up)
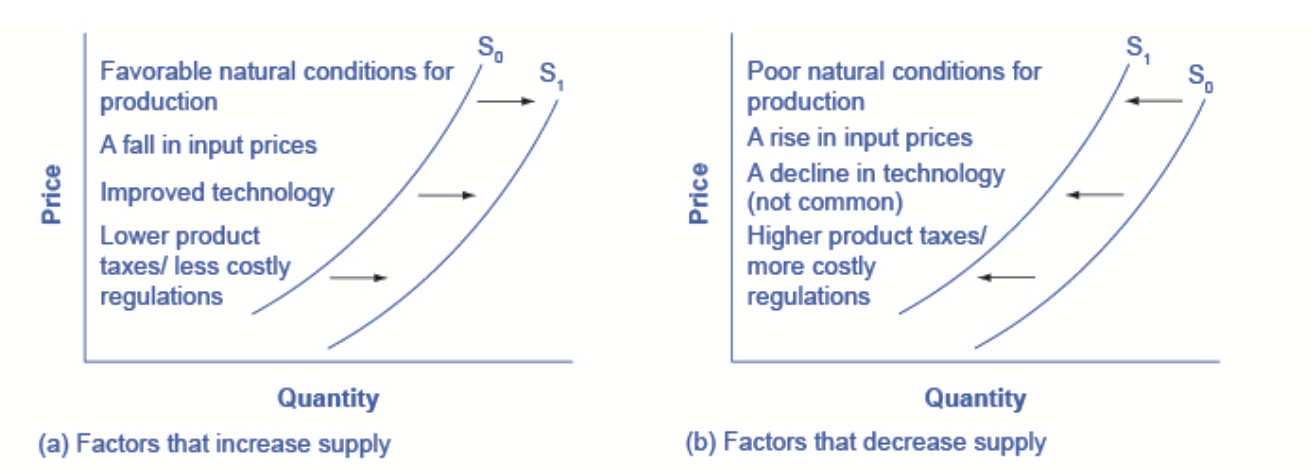
other factors that affect supply
changes in prices of inputs in production process affect cost of production → affect supply
changes in weather/natural conditions: agricultural products
new technologies for production: green revolution → right
government policies: taxes, regulations, subsidies
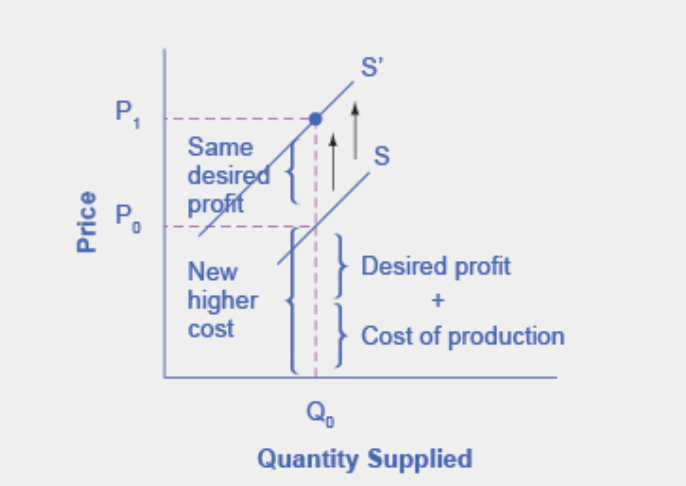
increase in cost causes upward (or leftward) shift of supply curve
summing up factors that change supply
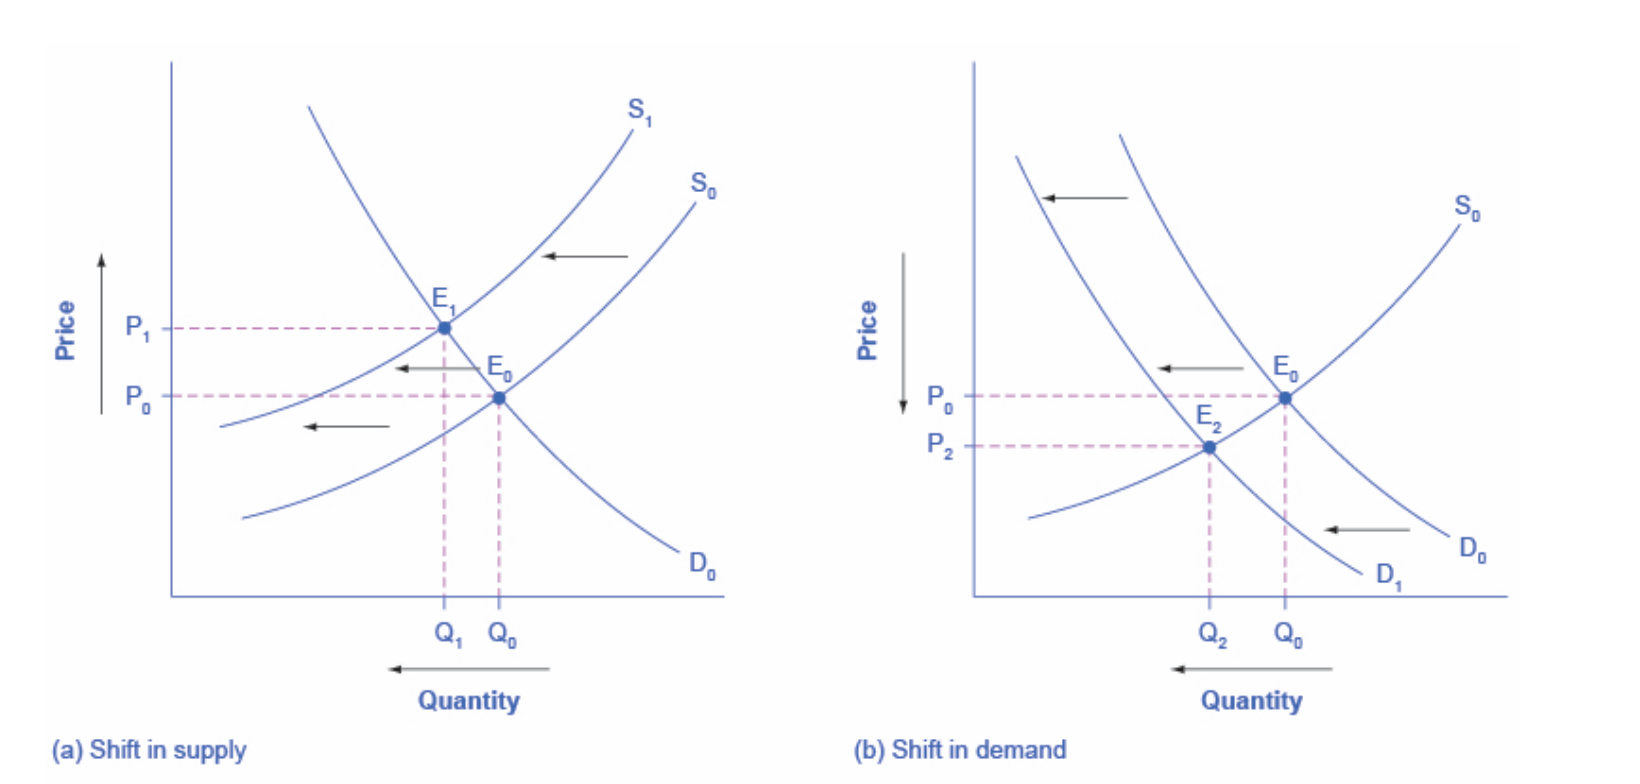
3.3 changes in eq price & quantity
how does an economic event affect equilibrium price and quantity?
draw demand & supply model before economic change
law of demand: slope of demand curve
law of supply: slope of supply curve
shift variables for demand
shift variables for supply
find initial equilibrium values for price & quantity
decide whether economic change affects demand or supply
decide whether effect on demand or supply causes curve to shift right or left, sketch new curve
identity new equilibrium
good weather for salmon fishing
weather conditions excellent for commercial salmon fishing
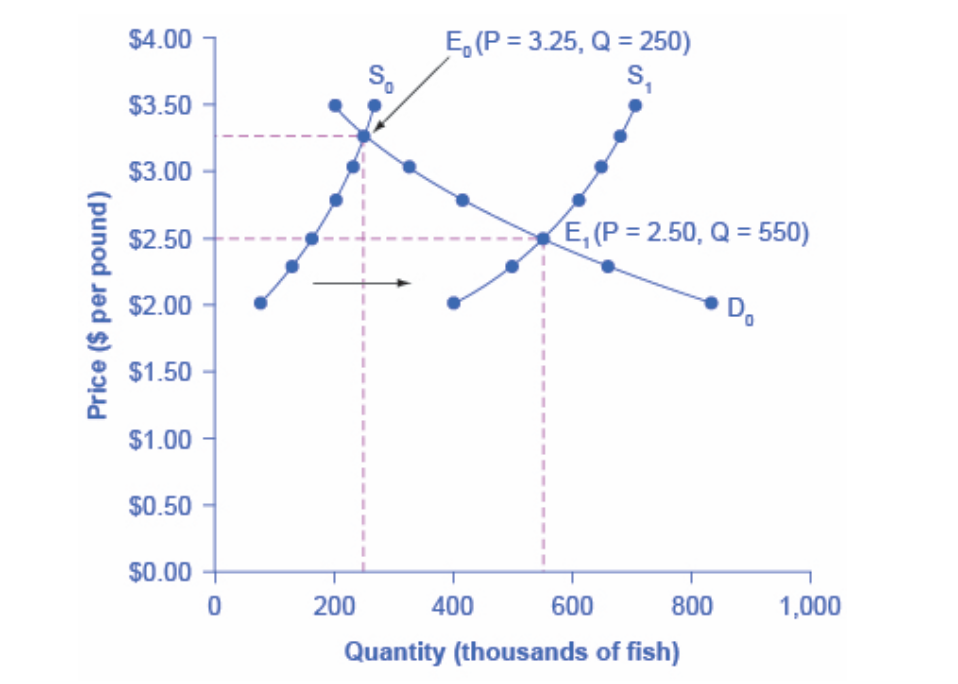
draw demand & supply model to illustrate market for salmon before good weather conditions
good weather affects supply
supply curve shifts to the right
compare equilibrium prices (higher quantity, lower price)
newspapers and the internet
tastes from print news → digital sources
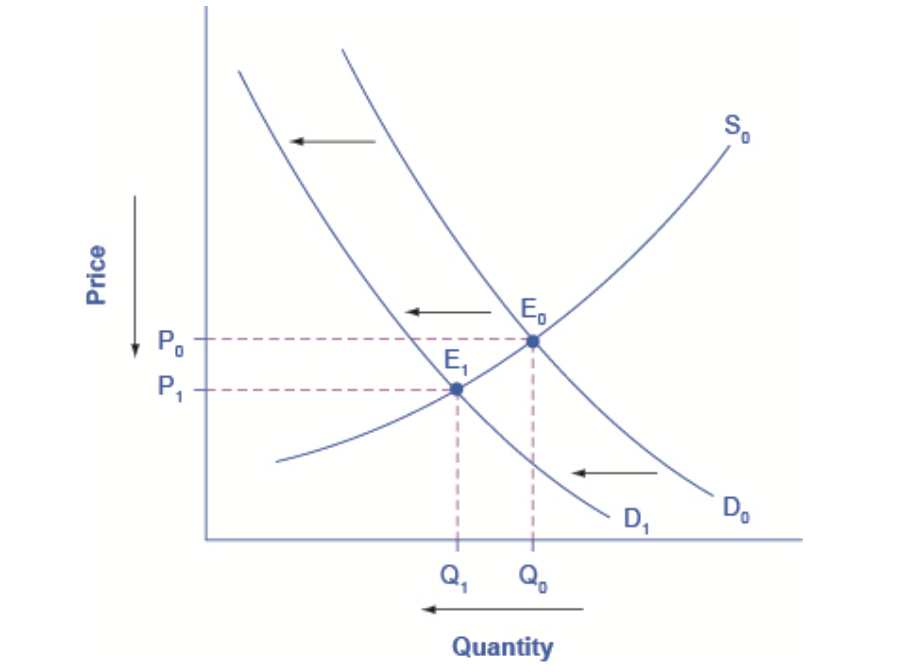
demand and supply model in before market
change in tastes causes change in demand
lower quantity demanded, shift to left
new equilibrium (lower quantity, lower price)
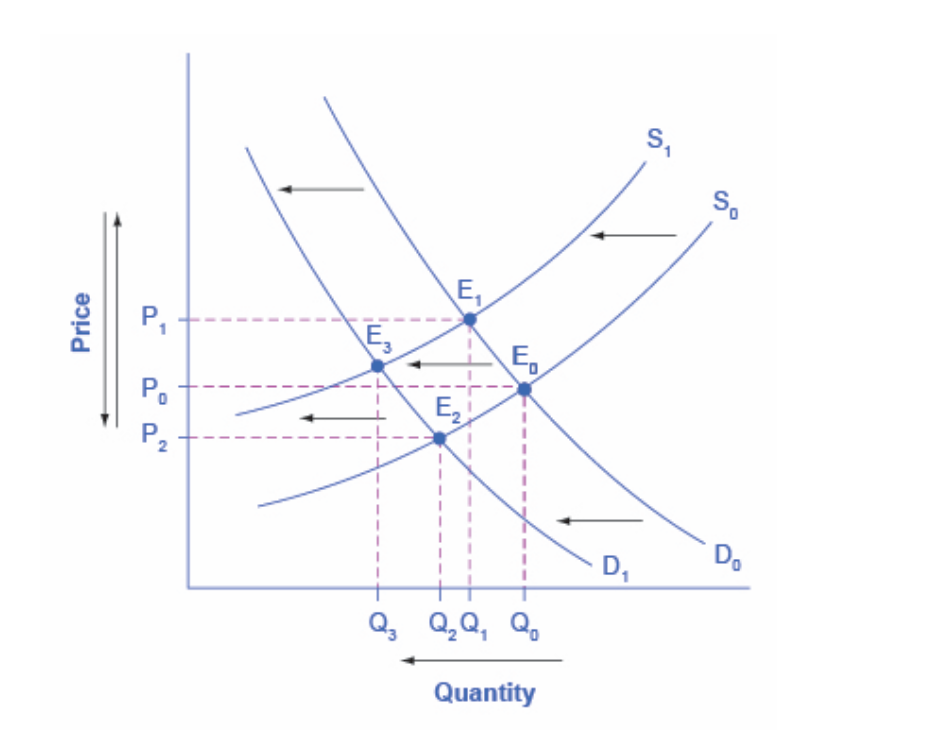
interconnections and speed of adjustments in real markets
demand for cars up bc of rising incomes & population
decrease bc of rising gas prices (complementary good)
supply for cars increase bc of innovative new tech
decrease bc of new gv regs requiring pollution tech
ceteris paribus assumption
combine analyses to see net effect
combined example
postal service
a) higher labor compensation → leftward shift in supply curve, decrease in equilibrium quantity, increase in equilibrium price
b) change in tastes away from postal services → leftward shift in demand curve, decrease in equilibrium quantity, decrease in equilibrium price
effect on quantity: decrease in equilibrium quantity
effect on price: unclear
difference between shifts of demand or supply vs movements
drought shifts back supply curve of crops
lower equilibrium quantity, higher equilibrium price
higher or lower price never shifts supply curve
price change leads to movement along supply curve
3.4 price ceilings & floors
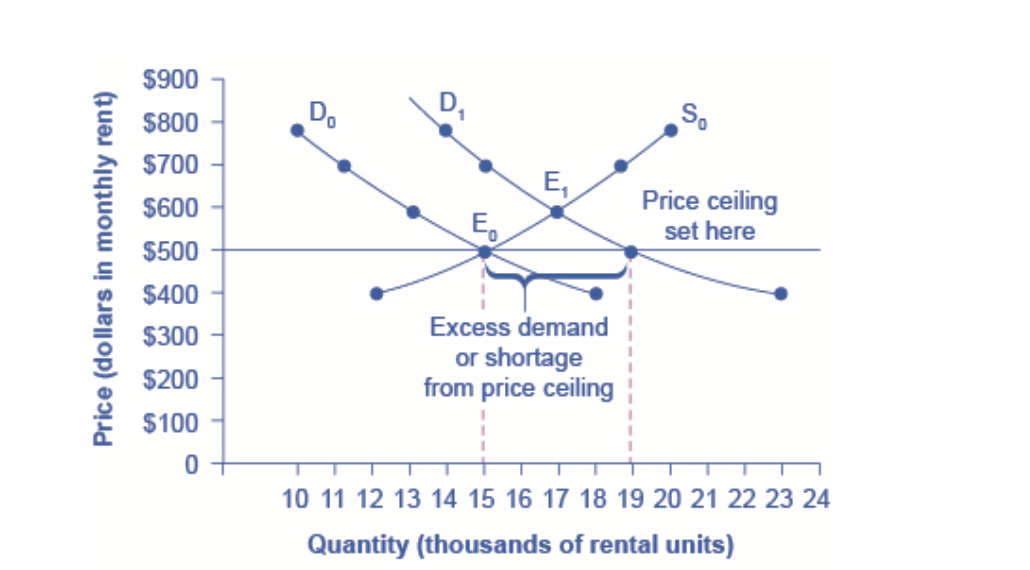
price ceilings
price controls: laws that government enact to regulate prices
price ceilings: keep price from rising above certain level
price floor: keep price from falling below given level
price ceiling: legal max price one pays for some good/service
keep prices affordable
rent control in urban areas (ny, dc, san francisco)
landlords spend less on maintenance and essentials
you do not get something for nothing (opportunity cost)
“cheaper” housing than market requires = lower quality
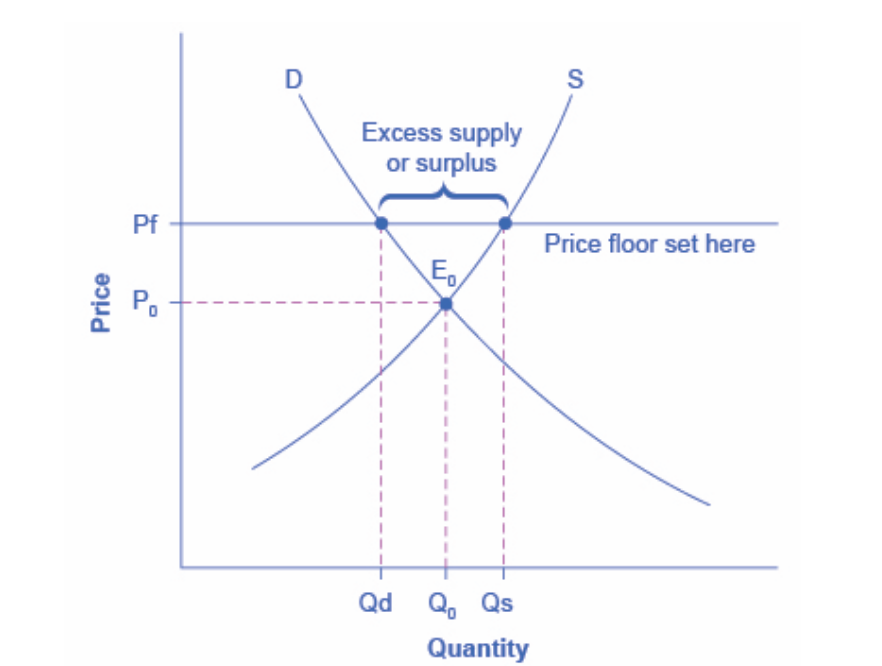
price floors
price floor: lowest price one can legally pay for good/service
minimum wage: full time worker should afford basic standard of living
as cost of living rises, congress raises federal min wage
“price supports”: government enters market and buys product
adding demand to keep prices higher
quantity supplied in excess of quantity demanded
in high-income areas (us, europe, japan) spend 1b per day supporting farmers
taxpayers and consumers of food pay costs
3.5 demand, supply, efficiency
efficiency: impossible to improve situation of one party wo imposing cost on another
efficiency in d&s model: economy getting as much benefit as possible from scarce resources, all possible gains from trade achieved (optimal amt good and service produced, consumed)
consumer surplus, producer surplus, social surplus
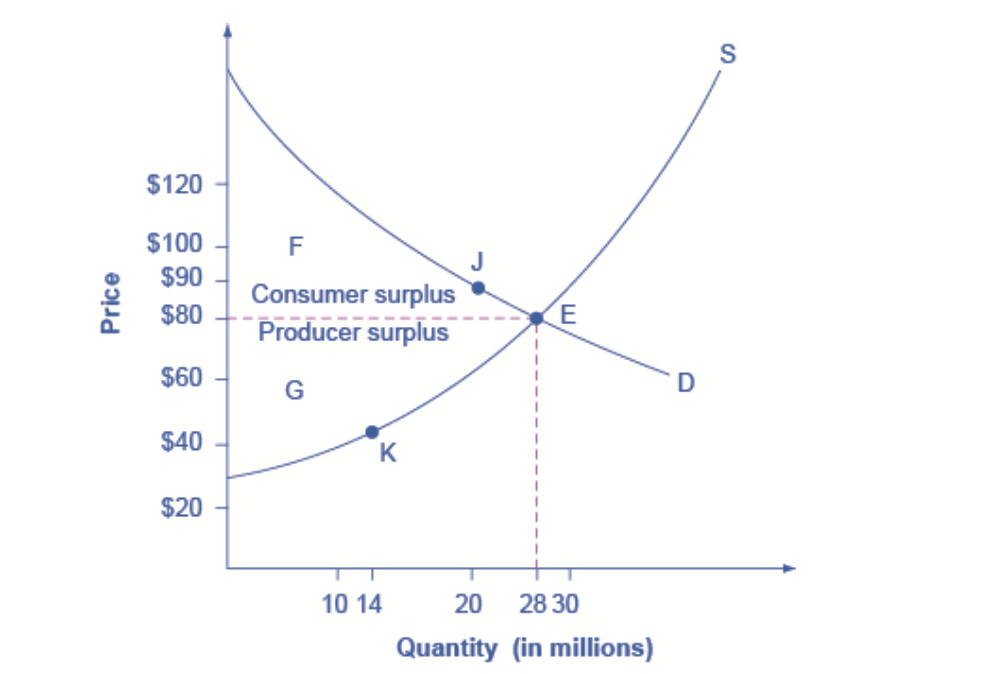
consumer surplus: amt individuals willing to pay - amt actually paid, area labeled F (area above market price, below demand curve)
producer surplus: amt seller paid for good - seller’s actual cost, area labeled G (area between market price & supply curve below equilibrium)
social surplus: sum of consumer surplus + producer surplus (economic surplus, total surplus), F+G
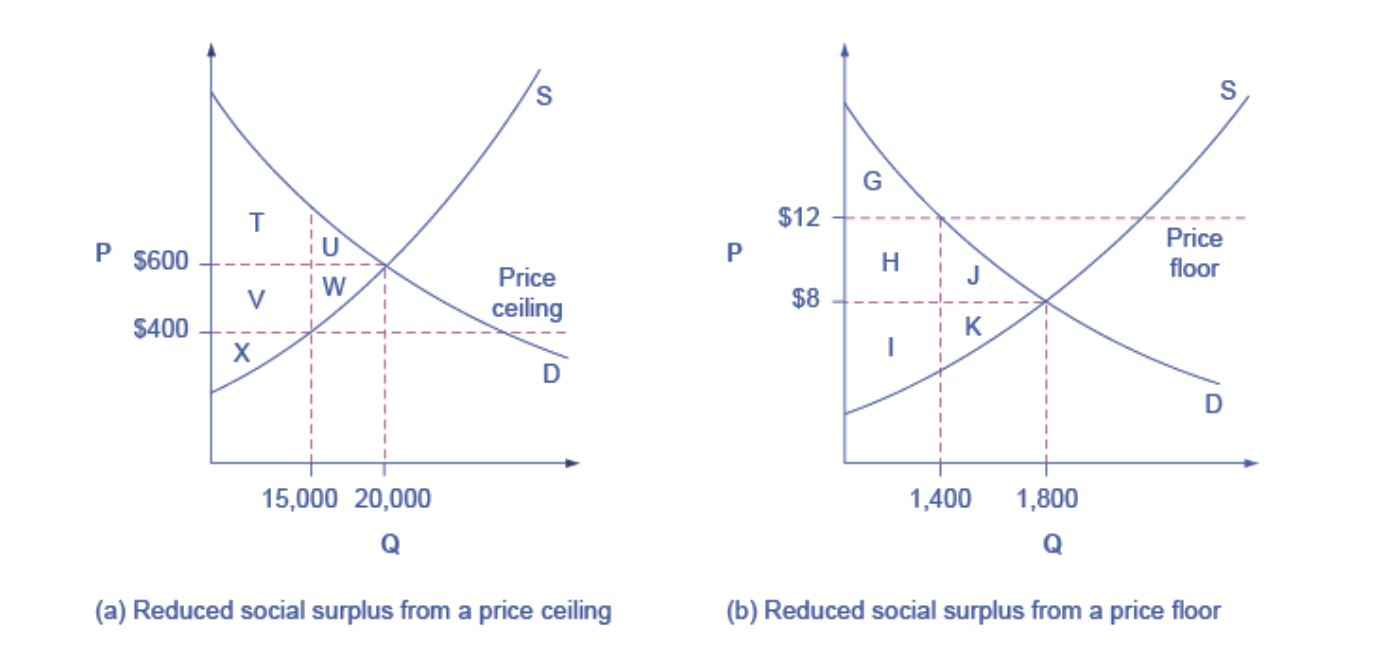
inefficiency of price floors and price ceilings
prevent market from adjusting to equilibrium price and quantity
inefficient outcome
transfer consumer surplus to producers or vice versa
deadweight loss: loss in social surplus that occurs when economy produces at an inefficient quantity, U+W
demand and supply as a social adjustment mechanism
demand and supply model emphasizes prices not set only by demand or only by supply, but by interaction between the two
adjustments of equilibrium in market-oriented economy without government direction or oversight
chapter 3 review
3.1 demand, supply, and equilibrium in markets for goods and services
demand schedule: table shows quantity demanded at diff prices in market
demand curve: relatoinship bw quantity demanded and price in given market on graph
law of demand: higher price = lower quantity demanded
supply schedule: quantity supplied at diff prices
supply curve: quantity supplied & price on graph
law of supply: higher price = higher quantity supplied
equilibrium price & quantitiy: where s&d curves intersect
if price below equilibrium, quantity demanded > supplied, shortage
3.2 shifts in demand and supply for goods and services
ceteris paribus: other things being equal
factors that shift demand curve cause diff quantity demanded
changes in tastes, population, income, prices of substitute/complement goods, expectations abt future conditions and prices
factors that shift supply curve cause diff quantity to be supplied
input prices, natural conditions, tech, gov taxes, regs, subsidies
3.3 changes in equilibrium price and quantity: four-step
sketch s&d diagram to see what market looks like before event
decide whether event affects supply or demand
decide whether effect on supply or demand is pos/neg
compare new equilibrium price and quantity to original
3.4 price ceilings and price floors
price ceilings prevent price from rising above certain level
price ceiling below equilibrium price → shortage
price floors prevent price falling below certain level
price floor above equilibrium price → surplus
3.5 demand, supply, efficiency
consumer surplus: gap between price consumers willing to pay (preferences) and market equilibrium price
producer suplus: gap between price producers willing to sell (costs) and market equilibrium price
social surplus: sum of consumer + producer surplus
total surplus: larger at equilibrium quantity and price than at any other quantity and price
deadweight loss: loss in total surplus when economy produces at inefficient quantity