CIE IGCSE Biology 19.1 Energy & Feeding Relationships Notes
19.1.1 Transfer of Energy
The sun is the primary source of energy for biological systems.
Energy flows through living organisms, including light energy from the sun and chemical energy within organisms.
Eventually, energy is transferred to the environment, often as heat.
19.1.2 Food Chains & Food Webs
A food chain illustrates the transfer of energy from one organism to another, starting with a producer.
The initial energy source in a food chain is sunlight.
Arrows in a food chain represent the energy transfer from one trophic level to the next.
Energy transfer occurs through ingestion (eating).
Food Chain Example
Position in Food Chain | Organism | Explanation |
|---|---|---|
Producer | Grass | Creates its own food using sunlight via photosynthesis. |
Primary Consumer | Mouse | Consumes the producer. |
Secondary Consumer | Barn Owl | Consumes the primary consumer. |
Food Webs
A food web is a network of interconnected food chains.
Food webs provide a more accurate representation of organism relationships within an ecosystem because animals rarely rely on a single food source.
Food webs demonstrates the interdependence of organisms.
They offer more information about energy transfer in an ecosystem.
They illustrate how changes in one population can affect others.
Example: Impact of Earthworm Population Decrease:
Grass population: would increase due to reduced consumption.
Frog and Mouse Populations: would decrease significantly because earthworms are their primary food source.
Sparrow Population: would decrease slightly since they have alternative food sources (caterpillars).
Human Impact on Food Webs
Most changes in animal and plant populations result from human activities.
These activities include overharvesting or introducing foreign species.
Such actions can have long-lasting effects on entire food chains or webs due to interdependence.
Exam Tip
When discussing population changes, it is better to use "decrease" or "increase" rather than "die out."
Always provide a reason for population increases or decreases.
19.1.3 Pyramids of Number & Biomass
Pyramids of Number
A pyramid of numbers represents the quantity of organisms at each trophic level.
The width of each level indicates the number of organisms.
Example Food Chain: Grass → Vole → Barn Owl
There are likely more grass plants than voles in an area.
A barn owl likely eats more than one vole per day.
There are probably fewer barn owls than voles in the same area.
Pyramids of numbers are not always pyramid-shaped because the size of organisms is important.
One large organism (e.g., an oak tree) can support numerous smaller organisms (e.g., insects).
Rules for Drawing Pyramids of Numbers:
The trophic level of each organism must be maintained.
Producers are at the bottom, followed by primary, secondary, and tertiary consumers.
Generally, larger individual organisms are fewer in number.
Pyramids of Biomass
A pyramid of biomass represents the dry mass of organisms at each trophic level, excluding water content.
Pyramids of biomass are always pyramid-shaped.
The mass of organisms decreases as you move up the food chain.
For example, its impossible to have 10kg of grass feeding 50kg of voles feeding 100kg of barn owls.
Biomass pyramids offer a better representation of the quantity of plant or animal material at each level.
They are a better way of representing interdependence within food chains.
Exam Tip
Pyramids of biomass are generally pyramid-shaped and easy to draw.
Pyramids of numbers can take various shapes, so it's essential to know drawing rules because unusual shapes are more common in exams.
19.1.4 Pyramids of Energy: Extended
Energy must be consumed to be passed on.
Not all energy received by grass plants is converted into new cells available for consumption.
Similarly, not all energy obtained by voles from grass or barn owls from voles is fully converted and passed on.
Only the energy that is made into new cells remains with the organism to be passed on.
Energy is stored in uneaten parts (e.g., roots, bones) so doesn’t get passed on.
Energy Loss
The majority of energy is lost or used through:
Waste production (e.g., urine).
Movement.
Heat (in mammals and birds).
Undigested waste (faeces), providing food for decomposers.
This inefficient energy loss limits food chain length to typically no more than 5 organisms.
Example: Barn Owl as Prey
An organism preying on a barn owl would receive only a small fraction of the owl's energy (e.g. 0.1J).
To survive, it would have to:
Consume a large number of barn owls daily.
Expend minimal energy hunting.
Energy Transfer in a Human Food Chain
Humans are omnivores and can obtain energy from plants and animals.
Consider these food chains: wheat → cow → human vs. wheat → human
Eating wheat directly provides more energy to humans than eating cows that eat wheat.
Energy is lost by the cows, reducing what is available to humans.
It is more energy-efficient for humans to be herbivores in a crop food chain.
In reality, we often feed animals plants we cannot eat or are too widely distributed for us (e.g., grass, algae).
Exam Tip
Understand the main ways energy is lost between trophic levels.
Tailor answers to the specific organism (e.g., plants don’t produce urine or faeces).
19.1.5 Nutrient Cycles
Nutrients like carbon and nitrogen are finite and need recycling.
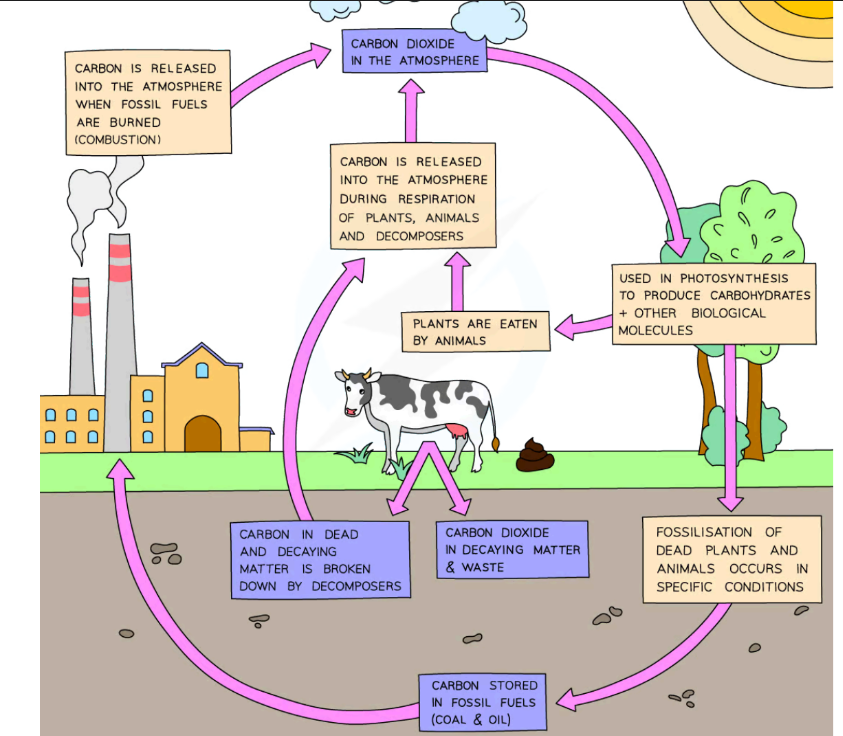
The Carbon Cycle
Carbon, as carbon dioxide, is taken from the atmosphere by plants for photosynthesis.
Carbon is passed to animals and microorganisms through feeding.
Carbon, as carbon dioxide, is returned to the atmosphere by plants, animals, and microorganisms through respiration.
Dead plants and animals, under specific conditions, can turn into fossil fuels over millions of years.
Burning fossil fuels (combustion) releases carbon dioxide into the atmosphere.
Increased fossil fuel use increases atmospheric carbon dioxide levels.
Deforestation reduces the number of producers that remove carbon dioxide.
Burning trees during deforestation releases more carbon dioxide.
Exam Tip
The carbon cycle involves carbon uptake via photosynthesis, transfer via feeding, and return via respiration and combustion.
Be able to identify each process in diagrams of the carbon cycle.
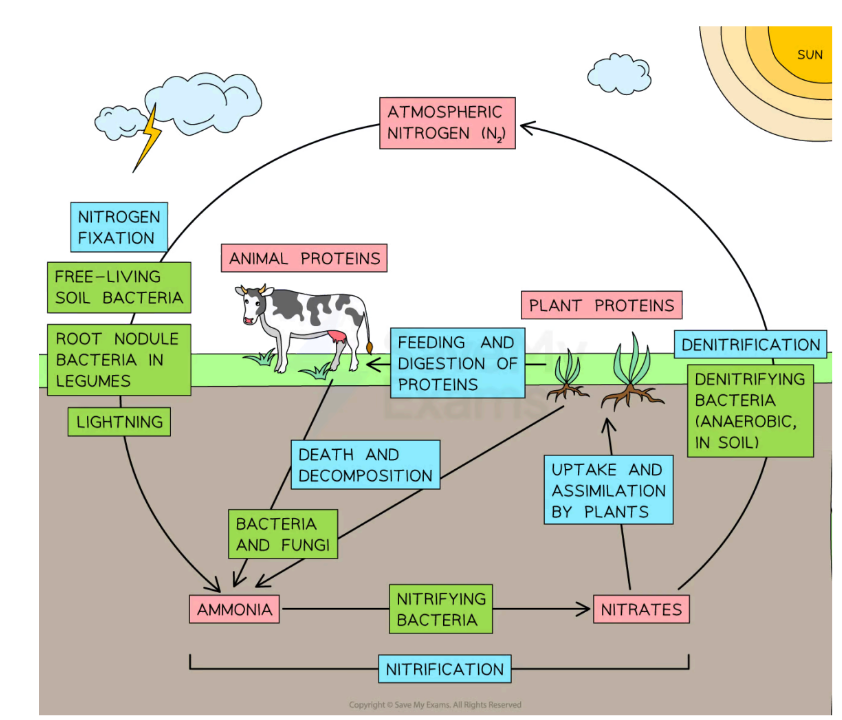
The Nitrogen Cycle: Extended
Nitrogen is essential for making proteins.
Plants and animals can't absorb nitrogen directly from the air.
Nitrogen gas (N_2) is very stable and not easily broken down.
Nitrogen Conversion methods:
Nitrogen-fixing bacteria convert N_2 gas into ammonium compounds, which are converted to nitrates.
These bacteria can be free-living or live in the root nodules of certain plants.
Lightning can split the bond between the two N atoms, turning them into nitrous oxides like N2O and NO2 that dissolve in rainwater and leach into the soil
Plants absorb nitrogen as nitrates from the soil to build proteins.
Animals obtain nitrogen from plant proteins by eating plants.
Nitrogen is passed up the food chain when consumers eat other consumers.
Animal waste (urine and faeces) returns nitrogen to the soil as ammonium compounds.
Urea in urine contains nitrogen.
Decomposers break down dead plants and animals into ammonium compounds.
Nitrifying bacteria convert ammonium compounds to nitrites, and then to nitrates, which plants can absorb.
Denitrifying bacteria convert nitrates back into N_2 gas, reducing soil fertility.
These bacteria are anaerobic. Aerating the soil can reduce denitrification.
19.1.6 Populations
A population is a group of organisms of one species living in the same area at the same time.
A community is all the populations of different species in an ecosystem.
An ecosystem consists of a community of organisms and their environment interacting together.
Population Growth
Organisms compete for food, water, and space.
Better-adapted organisms increase their populations.
Population growth is controlled by:
Food supply
Predation
Disease
The Population Growth Curve: Extended
Microorganism growth in a fermenter forms a sigmoid growth curve.
Graph shape: a little like an ‘S’
Phases of the Sigmoid Growth Curve:
Lag phase: Organisms adapt to the environment and are not yet reproducing rapidly.
Log phase (exponential phase): Food is abundant, birth rate is high, and death rate is low, leading to exponential growth.
Stationary phase: The population levels out due to limited resources; birth rate and death rate are equal.
Death phase: The population declines because the death rate exceeds the birth rate, often due to lack of food or toxic waste buildup.
Natural Environments
In natural environments, populations are affected by factors such as:
Temperature or light changes
Predators
Disease
Immigration
Emigration