2f. Profit
Profit
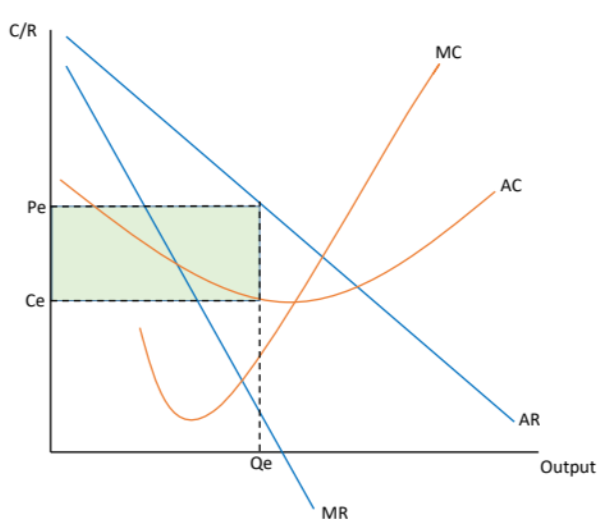
Profit is calculated by revenue minus costs.
When demonstrating it on a diagram it will be the difference between average revenue and average costs at a certain level of output.
If the average costs are higher than the average revenue, the firm will be making a loss.
To do this, AC, MC, AR, and MR all need to be on a diagram together.
Supernormal vs. normal profit
Supernormal or abnormal profit means that a firms AR is above the AC. This is the case on most diagrams.
If a firm is making normal profit it means that their AR equals their AC. In accounting this might mean a firm breaks even. In economics however, we are also considering the opportunity cost. Therefore at this point it is likely an accounting profit is being made (for example £25,000) but the owner of the firm could get a job (paying £25,000) instead. Therefore, although there is a profit, it only covers the opportunity cost and we refer to it as normal.
Levels of output for different objectives
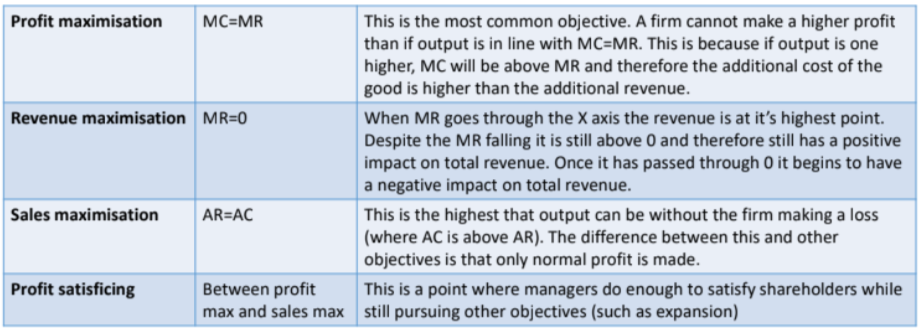
Profit maximisation
Output is found using MC=MR
The price is found by following the output level to the AR curve and then drawing across to the Y axis.
Without the costs, this represents the revenue that the firm is making.
To find the profit area, draw across to the Y axis from the point at which that level of output crosses the AC curve.
In this case the firm has made supernormal or abnormal profit
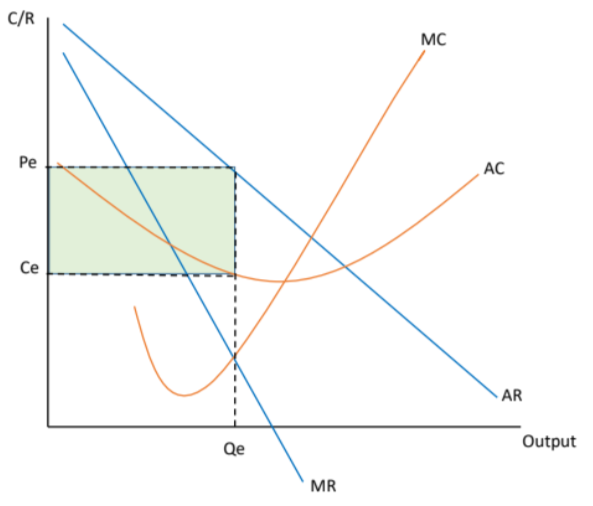
Revenue maximisation
Output is found using MR=0
The same process as before is then used to determine the price, costs and area of profit.
In this case the firm has made supernormal or abnormal profit
Compared the profit maximising point, price is lower, output is higher and the area of supernormal profit is lower. Costs are also likely to be lower at this point.
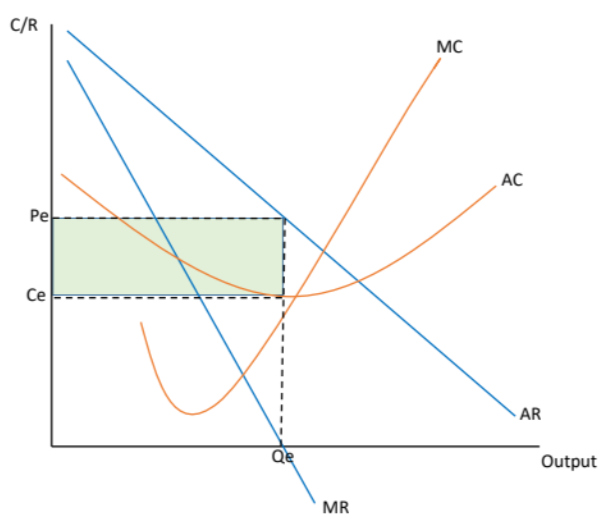
Sales maximisation
Output is found using MR=0
Because AR=AC there is no need to find the costs as these will be the same as the price.
In this case the firm only normal profit is made so therefore a shaded area cannot be shown.
Compared the profit max and revenue max, price is lower, output is higher and profit is lower.
Costs are also likely to be lower at this point.
Highest possible output without making a loss
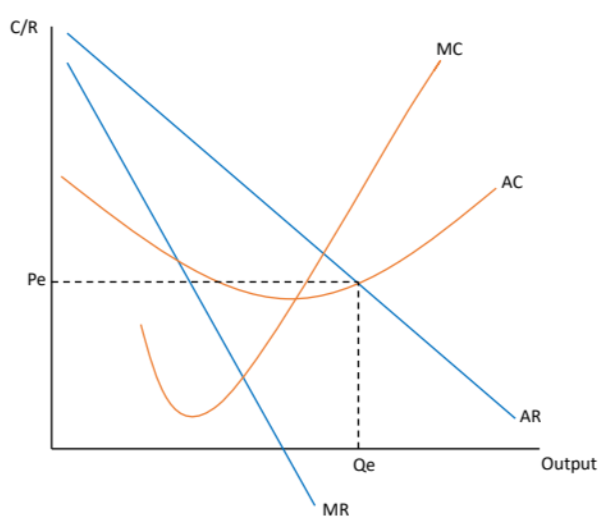
Profit satisficing
In this instance the output should go between the profit max and revenue max levels.
At this point it can be argued that the firm is making close to the maximum profit, so shareholders are happy, but does leave some profit available to be reinvested so the manager can achieve their own personal ambitions for the firm.
It’s a form of compromising between stakeholders and managers who hold different ideals usually in between profit and revenue max
the divorce between ownership and control
When AR shifts outwards
MR shifts out
Q will shift outwards ( Q is where MR crosses MC - in profit max)
P would increase due to Q shift
C depends on the diagram and the AC curve
Think about
What happens to output?
What happens to price?
What happens to profit?
When AR shifts inwards
MR shifts in
Q will shift inwards ( Q is where MR crosses MC - in profit max)
P would fall
C could change
Profit would fall
Think about
What happens to output?
What happens to price?
What happens to profit?
When MC shifts inwards
AC shifts up and centers itself
Q falls
P goes up
C goes up / depends on the graph
Profit falls
When MC shifts outwards
AC shifts down and centres itself
Q rises
P falls
C falls
Profit rises
When AC rises
Q stays the same
P stays the same
C rises
Profit decreases
When AC falls
Q stays the same
P stays the same
C falls
Profit increases