Infrared (IR) Spectroscopy
Spectroscopy studies how matter interacts with light. In Infrared (IR) spectroscopy, infrared light is used to obtain information from organic molecules. - IR spectroscopy involves the absorption of infrared light, which causes chemical bonds to bend and stretch.-
Electromagnetic spectrum basics:
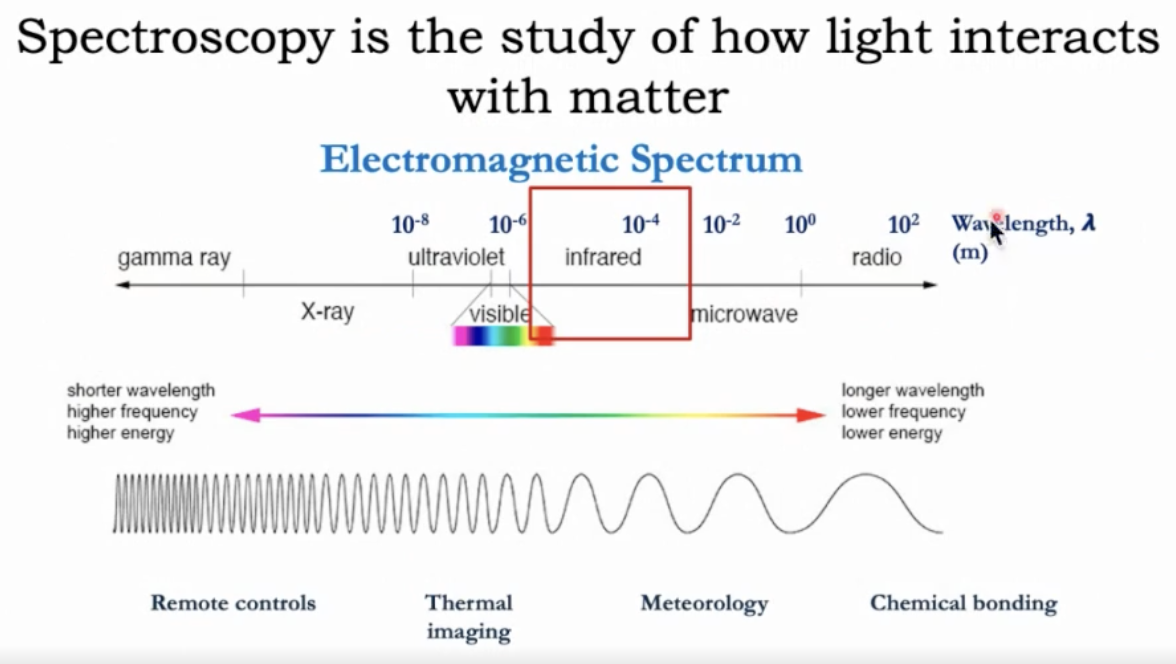
Higher energy corresponds to shorter wavelength and higher frequency; lower energy to longer wavelength and lower frequency. Wavelength () is often expressed in meters, centimeters, micrometers (m), or nanometers (nm). In IR, focus is on wavelengths roughly in the range of about which corresponds to wavenumbers roughly between 4000 and 400
The IR “wave number” basis:
The wavenumber is the inverse of the wavelength:
with units of when is in .The wavenumber is directly proportional to energy (as energy of light increases, so does the wave number):
so the higher the value of wavenumber means higher energy of the infrared light.
Core idea of IR spectroscopy in organic molecules:
Different chemical bonds absorb infrared light at specific wavenumbers.
The amount of energy required is determined by the atoms involved in the bond and the bond order.
This will hold true, no matter the structure of the rest of the molecule.
The spectrum shows how much light is transmitted (percent transmittance) as a function of wavenumber; dips (peaks in the spectrum) indicate absorption by specific bond vibrations.
Output spectrum basics:
Y-axis: percent transmittance (T%) — baseline 100% when nothing is absorbed.
X-axis: wavenumber , usually from high to low as energy decreases.
Absorptions appear as dips below the baseline; the position of a dip relates to a specific bond type or functional group.
Practical setup (instrumental context):
Samples can be placed on a pedestal in an IR spectrometer, or between salt plates for transmission IR.
The spectrum is generated by the computer as data from the sample-sensor interaction; the spectrum is a plot of % transmittance vs. wavenumber.
Why wavenumbers matter in IR:
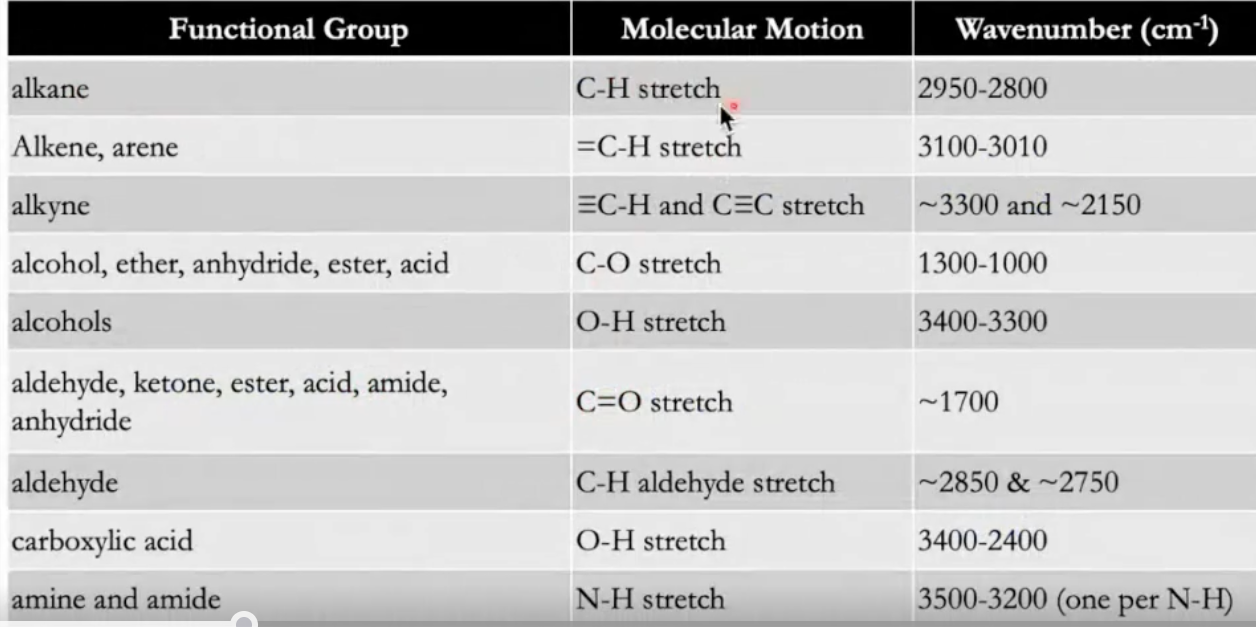
The spectrum is interpreted by comparing observed dips to known reference ranges for different bonds and functional groups (a correlation chart/table).
The correlation chart (functional-group table) associates ranges of with bonds such as C–H, C=O, N–H, O–H, C C, C N, etc.
Key qualitative points in interpreting IR data:
The data are inverse: a dip (absorption) corresponds to a vibrational transition; a flat region means little or no absorption at that wavenumber.
Use a spectral reference to match observed absorptions to likely functional groups.
Signals persist irrespective of other substituents in the molecule; if a particular bond feature is present, its characteristic absorption appears.
Common functional-group regions (conceptual guide drawn from the lecture examples):
Practical strategy for quick identification (as illustrated in the lecture):
Step 1: Focus on regions above to identify carbonyls or other strong features; if no carbonyl is present, you can often exclude carbonyl-containing groups (aldehydes, ketones, esters, amides, carboxylic acids).
Step 2: If a strong peak around 3400 is present with a broad, smooth shape, consider an alcohol group.
Step 3: For amines around 3400 , check the number of NH signals: primary (two NH peaks) vs secondary (one NH peak) vs tertiary (no NH peak).
Step 4: If a carbonyl is present, distinguish aldehydes by the Fermi doublet around 2850 and 2750 ; carboxylic acids by a very broad O–H signal in the 2500–3300 region in addition to C=O; amides by a concurrent C=O around 1650–1690 and N–H stretch around 3300–3500 (and possibly a second NH signal if primary); ketones by a carbonyl peak with primarily alkane-type signals and no additional diagnostic features.
Step 5: If a nitrile or alkyne feature is suspected, look for ~ for nitrile or ~3300 (terminal) or ~2100 (internal) for alkynes.
Example patterns discussed in the slides (summarized):
Alkanes: strong CH stretches around ; main alkane peak lies to the right of 3,000 (i.e., higher wavenumbers).
Alkenes: one peak to the left of 3,000 .
Aromatics: multiple signals in the aromatic region, with additional signals from substituents (e.g., a methyl group for toluene) to the left of 3000.
Alcohols: broad O–H around 3400 .
Amines: N–H stretch around 3400 ; primary amines show two N–H peaks; secondary amines show one; tertiary amines show none.
Aldehydes: carbonyl near 1700 plus Fermi doublet near 2850 and 2750 .
Ketones: carbonyl near 1700 and absence of amine, carboxylic, or aldehyde signal. You will likely see a signal for Carbon-based groups: alkane or arene. Easier to identify by elimination.
Nitriles/alkynes: sharp feature near 2150 for nitriles, triple bond; terminal alkynes around 3300 , internal around 2100–2150 .
Amide: An amine + carbonyl. Look for amine signal around 3400 and a Carbonyl signal at ~1700
Practical takeaways for exam and real-world use:
IR is excellent for confirming the presence of functional groups but generally does not provide full molecular structure on its own. It is most powerful when combined with other techniques (e.g., NMR, MS).
Always correlate IR signals with a reference table, consider both the wavenumber and the band shape, and use elimination strategies when multiple functional groups could be present.
Real-world relevance and connections:
IR spectroscopy is a routine, essential tool in organic synthesis, materials science, and pharmaceuticals for quick identification of functional groups and monitoring reactions (e.g., tracking carbonyl formation, amide formation, alcohol oxidation states).
Conceptual link to foundational chemistry: vibrational transitions, harmonic oscillator model intuition, and the idea that bond strength and mass affect vibrational frequencies.
Note: This set of notes reflects the instructor’s emphasis on recognizing peak positions, peak shapes, and using the correlation chart in conjunction with the problem-solving strategy shown in the video. The goal is to enable rapid functional-group identification from IR spectra and to train the eye for pattern recognition through exposure to multiple example spectra.