Economics
A social science that studies the optimal/efficient allocation and distribution of scarce resources to satisfy unlimited human wants and needs
KEY TERMS
Scarcity - The state of being scarce or short in supply
Trade-offs - Giving up one thing in return for another
opportunity costs - Cost of the decision that wasn’t chosen, EX. Instead of studying you play. and the opportunity cost is being able to study to get a good grade
Macroeconomics and Microeconomics
macro - economy as a whole (Interest rates, national productivity)
micro - single factors and effects of individual decisions by decision takers (households, firms)
Fields of Study in Economics
Agriculture, Natural Resources, Environment, Development, Labor, Behavioral, Financial, Monetary, Business, Health and education, Mathematical/Quantitative, History, International Trade and Finance
Ten economic principles
1. People Face Trade-offs
When you have to choose an option that causes you to lose something as well
2. Opportunity cost
The cost of something is what you give up to get it
3. Rational people think at the margin
if the people is giving benefits accept the person, you decide on the additional cost/benefit
4. People respond to Incentives
People are more willing to do work when there is reward in return from it
5. Trade can make everyone better off
This economic principle may not be appliable to all but some trades may make everyone better off.
6. Markets are usually a Good way to optimize Economic Activity
Trades in the market can be used to determine if there are many demands for a certain product or how much supply there is
7. Governments Can sometimes improve market outcomes
Pandemic, vaccines
8. A country's standard of living depends on its ability to produce goods and services
trade offs due to scarce resources, have to make choices because of scarce resources
9. Prices rise when the government prints too much money
Inflation
10. Society faces a short run trade off between inflation and unemployment
Increasing employment, prices go up, inflation go up - lesser employees prices go down, inflation go down
Four Fundamental Economic Questions
1. What to produce
2. How to produce
3. How much to produce
4. For whom to produce
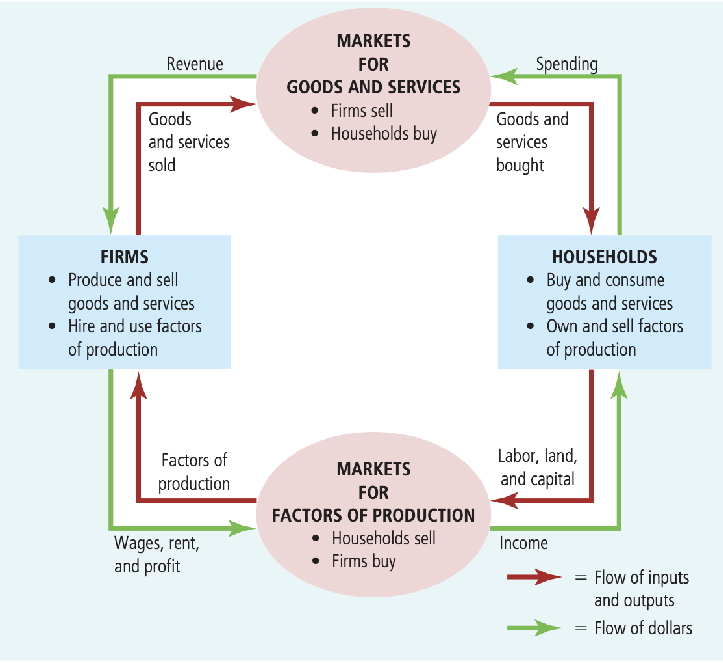
The circular flow diagram
The circular flow diagram

Flow of dollars - FGHP firms, goods, households, production flow of input reverse, PHGF
Households (buy and consume goods and services) - Markets for Goods and Services (Profit from the purchases of households) - Firms (use profit to expan factory and production) - Markets for Factors or Production (goes into wages and rent and profit)
FGHP - firms, goods, households, production
PHGF - sell to households, buy and consume, households buy. produce and sell
MODULE - 2
—————————————————————-
Economist as Scientist
Scientific Method - Acquiring knowledge with careful observation through testing and experimenting
Role of Assumptions - Assume something even without proof
Economic Models - Simplified models of reality
Economist as Policy Adviser
Positive(Describing) vs normative(To prescribe, must, should) analysis
For malacanang palace, Batasan Pambansa - to keep order
Economic policy is a messy affair - Economics isn’t something that everyone can agree upon as there are conflicting opinions and ideas
Economic Systems
government - private - mixed economy
private laissez Faire' - let people do as they choose “allow to do
Why Economists Disagree
Difference in Scientific Judgements
Difference in Values
Perception vs Reality
People
John Maynard Keynes - founder of modern macroeconomics, philosophical or politician both still hold great influence over economics “The market will sort itself out but, in the long run we are all dead“ Does not believe in the invisible hand, the government should take initative
Adam Smith - believed that government should enforce contracts, copy rights and ideas “father of economics“
positive - based on observation this graph is increasing
normative - this graph should increase
Fiscal Policies - budget balance, deficit, surplus (Taxes - Govt Spending)
Monetary Policies - Money supply, inflation rate, interest rate (Savings - Investments)
Trade Policies - Trade balance, surplus, deficit (Imports - Exports)
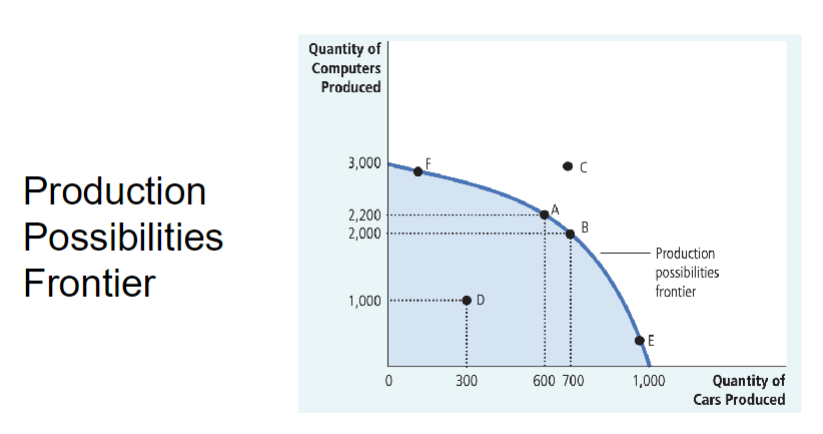
Production Possibilities Frontier (PPF)

Definition
The Production Possibilities Frontier (PPF) is a curve that illustrates the maximum feasible amount of two goods that an economy can produce with available resources and technology.
Key Concepts
Opportunity Cost: The cost of forgoing the next best alternative when making a decision. Represented by the slope of the PPF.
Efficiency: Points on the PPF represent efficient production levels. Points inside the curve indicate inefficiency, while points outside are unattainable with current resources.
Trade-offs: Moving along the PPF shows the trade-off between the production of two goods.
Shape of the PPF
Concave Shape: Typically bowed outward due to increasing opportunity costs. As production of one good increases, more of the other good must be sacrificed.
Linear PPF: Indicates constant opportunity costs, which is rare in real-world scenarios.
Shifts in the PPF
Outward Shift: Indicates economic growth, improvements in technology, or an increase in resources.
Inward Shift: Represents a decrease in resources or a decline in technology, leading to reduced production capacity.
Applications
Resource Allocation: Helps in understanding how to allocate resources efficiently between different goods.
Economic Planning: Assists policymakers in visualizing trade-offs and making informed decisions about production priorities.
Examples
Guns vs. Butter: A classic example illustrating the trade-off between military goods (guns) and consumer goods (butter).
Agricultural Production: A farmer deciding between planting corn or wheat, illustrating the opportunity costs involved.
Limitations
Simplification: The PPF simplifies complex economic realities and assumes only two goods.
Static Analysis: It does not account for changes in technology or resources over time unless shifts are illustrated.
Conclusion
The PPF is a fundamental concept in economics that helps visualize trade-offs, opportunity costs, and the implications of resource allocation decisions. Understanding the PPF is essential for analyzing economic efficiency and growth.
MODULE 3
Recession
decline of real GDP for at least two consecutive quarters (shorter)
Depression
decline of real GDP lasting several years (longer)
The great depression 1929-1939
1920s - Roaring 20s
1929 - Black Thursday, Black Tuesday, 10 million jobless, Dust bowl migration( )
1933 - GDP bounced back 9%
1937 - Sharp recession
1939 - recession
1941 - WWII begins
What is great depression?
The worst economic crisis in 20th century
Between 1929 - 1933
output in the US declined by 1/3
Unemployment rate increased by 25%
inflation rate declined by 2% - 5%
stock market lost 80%
7,000 banks failed
Absence of regulatory institutions
as GDP goes up EMPLOYMENT goes down, as GDP goes down EMPLOYMENT goes up
Causes of Great Depression
1920’s: Sum of Excesses
1929 stock market crash
Misguided government policies
Consumers’ pessimism
Smooth-Hawley Tariff of 1930
Collapse of banking system
Contraction of money stock
Four day Nationwide Bank Holiday
Shut down banking system
Restored consumer confidence to banks
Emergency Banking Act of 1933
Federal Reserve created de facto 100% deposit insurance
Reestablished integrity of US banking system
New Deal (1933-1939)
Three R’s: Relief (for unemployed and poor), Recovery (of the economy), Reform (of financial system)
New Deal Coalition: labor unions, blue collar workers, minorities
Tennessee Valley authority - govt program
Works progress administration - govt program
Federal Deposit Insurance Corp.
Mission
Insures Deposit
Examines and supervises financial institutions
Works to make large and complex financial institutions resolvable
Manage receiverships
created in response to the thousands of bank failures that occurred in the great depression
Securities and Exchange Commission
enforce laws against market manipulation
Mission
protect investors
Social Security act of 1935
created a social insurance program designed to pay retired workers age 65 or older a continuing income after retirement
unemployment insurance
MODULE 4
4 Key Macroeconomic Variables
Economic output: GDP Growth Rate
Overall Prices: Inflation Rate
Labor: Unemployment Rate
Trade: Exports and Imports
→ They all have social implications
Gross Domestic Product
Total market value of all final goods and services produced within an economy in a given period of time
Total expenditure on domestically-produced final goods and services
Total income earned by domestically located factors of production
Focus: Production Side
Market Value: Currency
There’s a territorial aspect, within an economy of a country
GDP is the aggregate of gross value added (GVA) of all resident producer units in the country
Value Added
A firm’s value added is the value of its output minus the value of the intermediate goods the firm used to produce that output
Gross National Income (Formerly, Gross National Product)
Income of your citizens regardless of where they are, walang pake sa territory basta citizen ka ng country

Calculating GDP: Expenditure Approach
Produced in the country
Consumption is 70-75% of all goods and services produced; consumables
GDP:
Overall positive gdp growth rate given growth rates in C, I, and G, even through m is larger than x
C
Strong filipino consumer base driven by young, dynamis, anc economically, active population
M
Is always red because imports are not part of the gpd
Height of COVID (2020)
C = Down (consumption)
I = Down (Investment)
G = UP (Government)
X(export) M(Import) = Down
Covid 2021
C = UP
I = UP
G = UP
X - M = UP
RUSSA-UKRAINE CONFLICT 2022
C = Down
I = Down
G =
X - M =
2023 and Beyond
C = UP
I = UP
G = UP
X - M = UP
Calculating GDP = Value-added Approach
Agriculutre + Industry + Services = GDP
Nominal vs. Real GDP
Nominal - valued at current prices (same values 1-1, 2-2, 3-3)
Real - valued at constant prices (same price 1-1, 2-1, 3-1)
GDP = Quantity x Price
Base Year - normal year (no typhoons, disasters, financial meltdowns)
GDP Deflator - A measure of the price level calculated as the ratio of nominal GDP to real GDP times 100
Principle #8
A country’s standard of living depends on its ability to produce goods and services
Inflation
Situation in which the economy’s overall price level is rising
How to get inflation rate
Consumer Price Index
Like the GDP deflator, it also measures price level
Composed of selected prices of goods and services bought by atypical consumer
More popular measure than GDP deflator
CPI and INflation Rate: Philippine Definition
CPI - An indicator of change in the average retail prices of fixed basket of goods and services commonly purchased by households for their day-to day consumption relative to a base year
5 Steps for Calculating CPI and Inflation Rate
Survey consumers to determine a fix basket go goods
Find the price of each good in each year
Compute the cost of the basket of goods in each year
Choose one year as a base and compute for cpi in each year
Use the CPI to compute the inflation rate from previous year
Homework
Cost of Basket
360
440
520
CPI
100
122.2
144.4
Inflation rate
N/A
22.2%
18.1%
Labor Force
Labor force participation rate: fraction of adult population who are in the labor force
Labor Force
aka economically active population refers to persons 15 years old and over who are either employed or unemployed
Unemployment rate: the fraction of labor force is not employed
Unemployment rate = Number of unemployed/labor force * 100
Labor-Force participation rate = Labor force/adult population * 100
Underemployed
include all employed persons who expressed the desire to have additional hours of work in their present job or an additional job, or to have a new job with longer working hours
Unemployed
Include all those who, during the reference period are 15 years old and over as of their last birthday who have no job/business and actively looking for work. Also considered as unemployed are persons without a job or business who are reported not looking for work because of their belief that no work was available or because of temporary illness/disability, bad weather, pending job application or waiting for job interview.
Persons not part of Labor Force
15 years old and over who are neither employed nor unemployed according… Those not in the labor force are those persons who are not looking for work because of reasons such as housekeeping schooling
Arthur M. Okun (1928 - 1980)
American Econoimst, Yale Professor
PhD at Columbia Uni
Okun’s Law
GDP and unemployment rate and negatively related
inversely related
Misery Index
sum of inflation rate and unemployment rate
Module:5 Government and the Economy
Promote inclusive, sustainable, equitable economic growth
Government
provide goods and services
set standards
regulatory framework
maintain or enhance competition
redistribute income
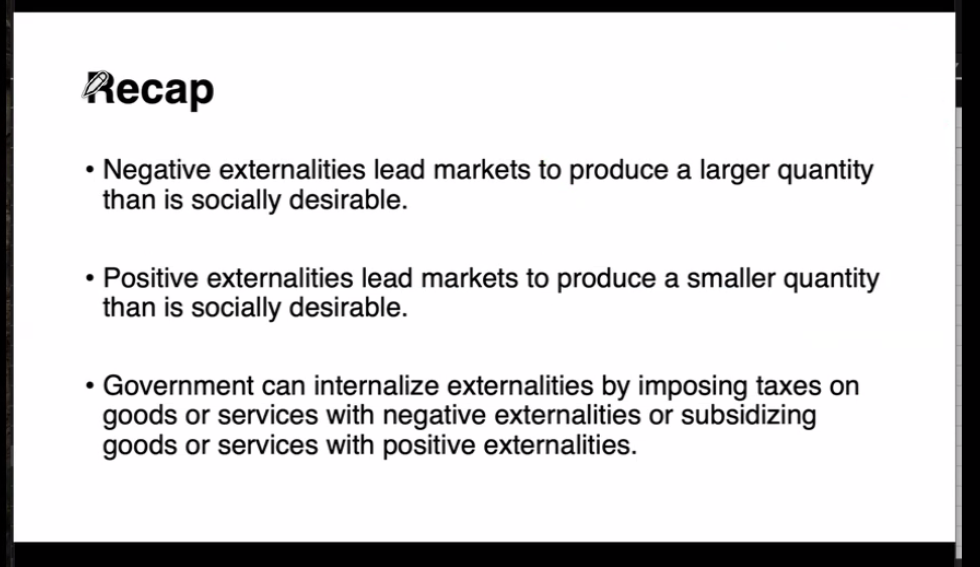
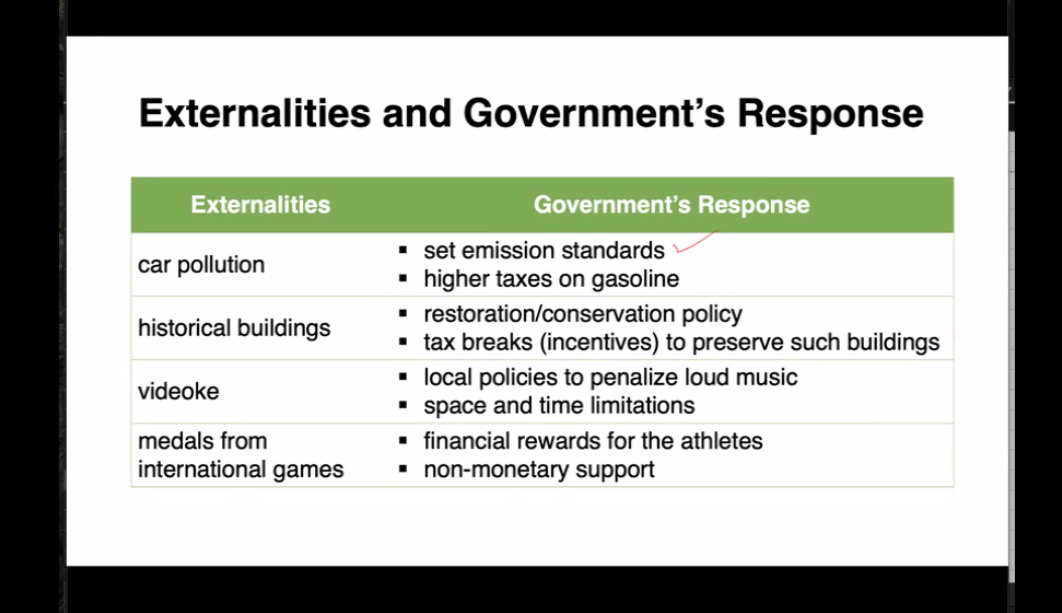
address externalities
Market Failure
not optimal distribution of goods and services in the market
Externalities
The uncompensated impact of one person’s actions on the-well being of a bystander


