Straight Line Graphs Using Tables
Straight Line Graphs Using Tables
Introduction
The study of straight line graphs involves plotting linear equations on the Cartesian plane using the method of tables.
A linear equation typically corresponds to a straight line when plotted.
Basic Concepts of Lines and Functions
A linear equation can be represented in the form: where:
is the slope of the line.
is the y-intercept (the value of when ).
Summary
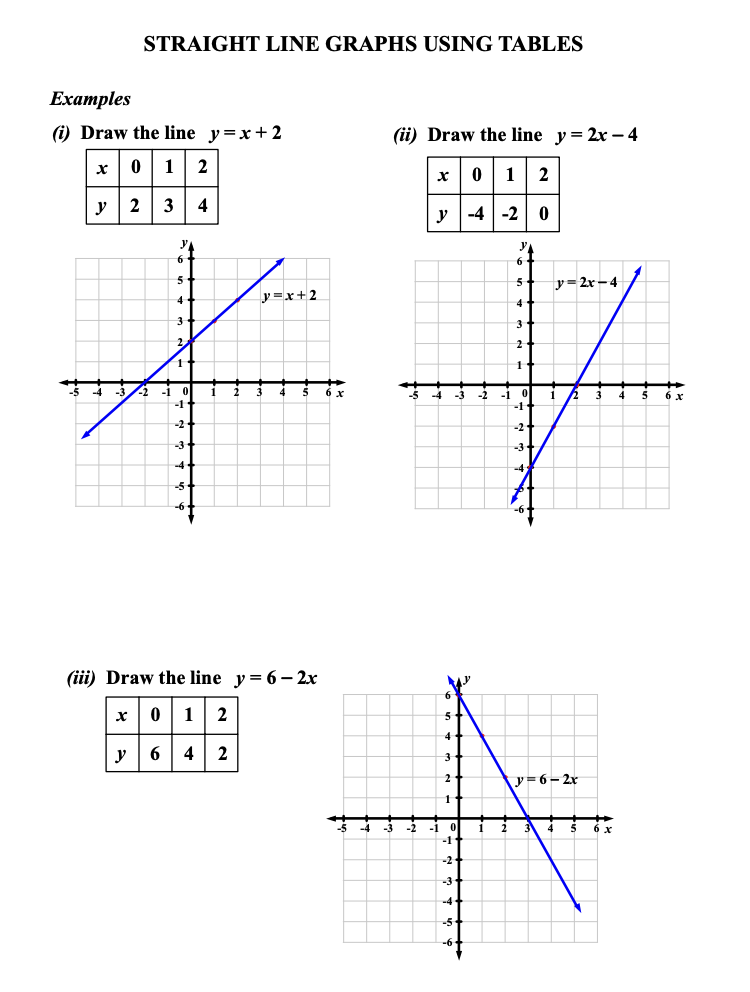
To draw straight line graphs using tables, one needs to:
Choose a linear equation.
Create a table of values by substituting different values of and solving for y. Then, plot the points corresponding to each pair of (x, y) on a graph and connect them with a straight line to visualize the linear relationship. This method allows for the identification of key features such as the slope and intercept, which can be further analyzed to understand the behavior of the linear equation. Lastly, it's important to label the axes and provide a scale to ensure accuracy and clarity in the representation of the data.
Plot those points on the Cartesian plane to visualise the line.