Box plots
Minimum, maximum, median, first quartile, and third quartile
DATA SET: {24, 25, 26, 27, 30, 32, 40, 44, 50, 52, 55, 57}

Box and Whisker Plots display a five statistical summary.
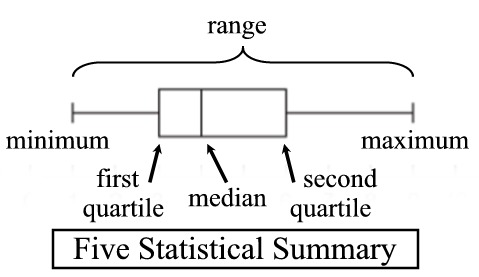
The first and third quartiles are the ends of the box
the median is indicated with a vertical line in the interior of the box
the minimum and maximum are the ends of the whiskers (unless an outlier is present).
Each of the four "sections" of a box plot represents 25% of the data in the set.
Q1: The first quartile is the middle (the median) of the lower half of the data set. One-fourth (25%) of the data lies below the first quartile, and three-fourths (75%) lies above.
Q2:The second quartile is another name for the median of the entire set. One-half (50%) of the data lies below the second quartile, and one-half (50%) lies above.
Q3:The third quartile is the middle (the median) of the upper half of the data set. Three-fourths (75%) of the data lies below the third quartile and one-fourth (25%) lies above.
A quartile is a number, it is not a range of values.
Interquartile range (IQR).
Definition: The difference between the third quartile and first quartile
The interquartile range (also called the midspread or middle fifty), is the distance between the third and first quartiles and is considered a more stable statistic than the "range" of the set.
The IQR contains 50% of the data.
IQR = Q3 - Q1
Finding the median when the number of data points is even
4, 7, 9, 12, 15, 18
Find the middle two numbers: 9 and 12
Average them: 9 + 12 / 2 = 10.5
Outlier definition: A data point that lies far away from the rest of the data—it’s unusually high or low compared to most values
The outlier is plotted as a single dot (or asterisk *), separate from the box's whisker . The whisker then uses a separate number as its minimum point.
Shapes of plots
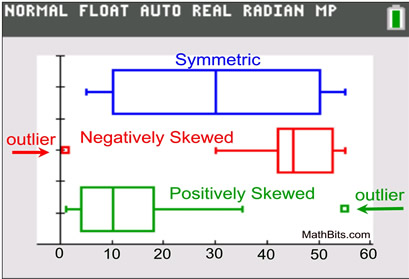
Symmetric: If a box and whisker plot is symmetric, the median is equidistant from the minimum and the maximum.
Negatively Skewed: If a box and whisker plot is negatively skewed, the distance from the median to the minimum is greater than the distance from the median to the maximum.
Positively Skewed: If a box and whisker plot is positively skewed, the distance from the median to the maximum is greater than the distance from the median to the minimum.