2.2-2.3
Summarizing quantitative data:
Determine whether the data is discrete or continuous
If the data is discrete & there’s a few different values of the variable, the categories of data (classes) will be the observations (as in qualitative data)
If the data is discrete but there are many different values of the variables, or the data is continuous, the categories of data (the classes) must be created using intervals of numbers.
Classes- Categories into which data are grouped
When a data set has a large number of different discrete data values or when a data set consists of continuous data, we have to make classes by using intervals of numbers
Lower class limit- The smallest value within the class
Upper class limit- The largest value within the class
Class width- The difference between consecutive lower class limits
Example:
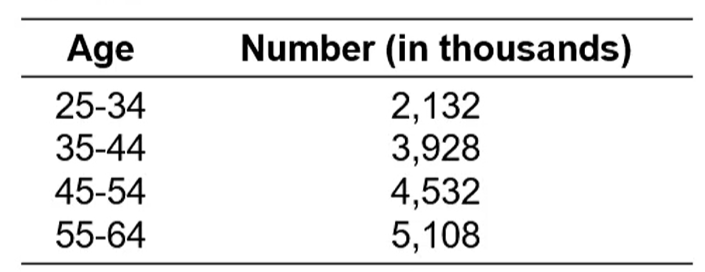
The lower class limit of first class is 25
The lower class limit of second class is 35
The upper class limit of first class is 34
Class width:
Histogram: It’s made by drawing rectangles for each class of data.
The height of each rectangle is the frequency or relative frequency of the class
Stem and leaf plot: It uses digits to the rightmost digit to form the stem
Each rightmost digit forms a leaf
Example: A data value of 147 would have 14 as the stem and 7 as the leaf
Dot plot: It places each observation horizontally in increasing order and placing a dot above the observation each time it is observed
Uniform distribution- The frequency of each value is evenly spread out across the values of the variable
Bell-shaped- The highest frequency is in the middle and the frequencies tail off to the left and right
Skewed right- More data at the left
Skewed left- More data at the right
Determining the Lower Class Limit of the First Class and Class Width:
Choosing the lower class limit of the first class
Choose the smallest observation in the data set or a convenient number slightly lower than the smallest observation in the data set
Determining class width
Pick on the number of classes
The smaller the data set, the fewer classes you should have
Class width: largest data value - smallest data value / number of classes
Round this value up to a convenient number
Guidelines for good graphics:
Provide explanations if needed and include units of measurement
Never lie about data
Minimize the amount of white space in the graph
if the scale is truncated, indicate this to the reader
Avoid clutter and unnecessary backgrounds or pictures
avoid 3D graphics