BIOL 2200 Lecture 4: Genetic variation & the Hardy-Weinberg equation
Page 1: Introduction
Lecture Title: Genetic variation & the Hardy-Weinberg equation
Page 2: Learning Objectives
Compare Phenotypic Plasticity to Evolution
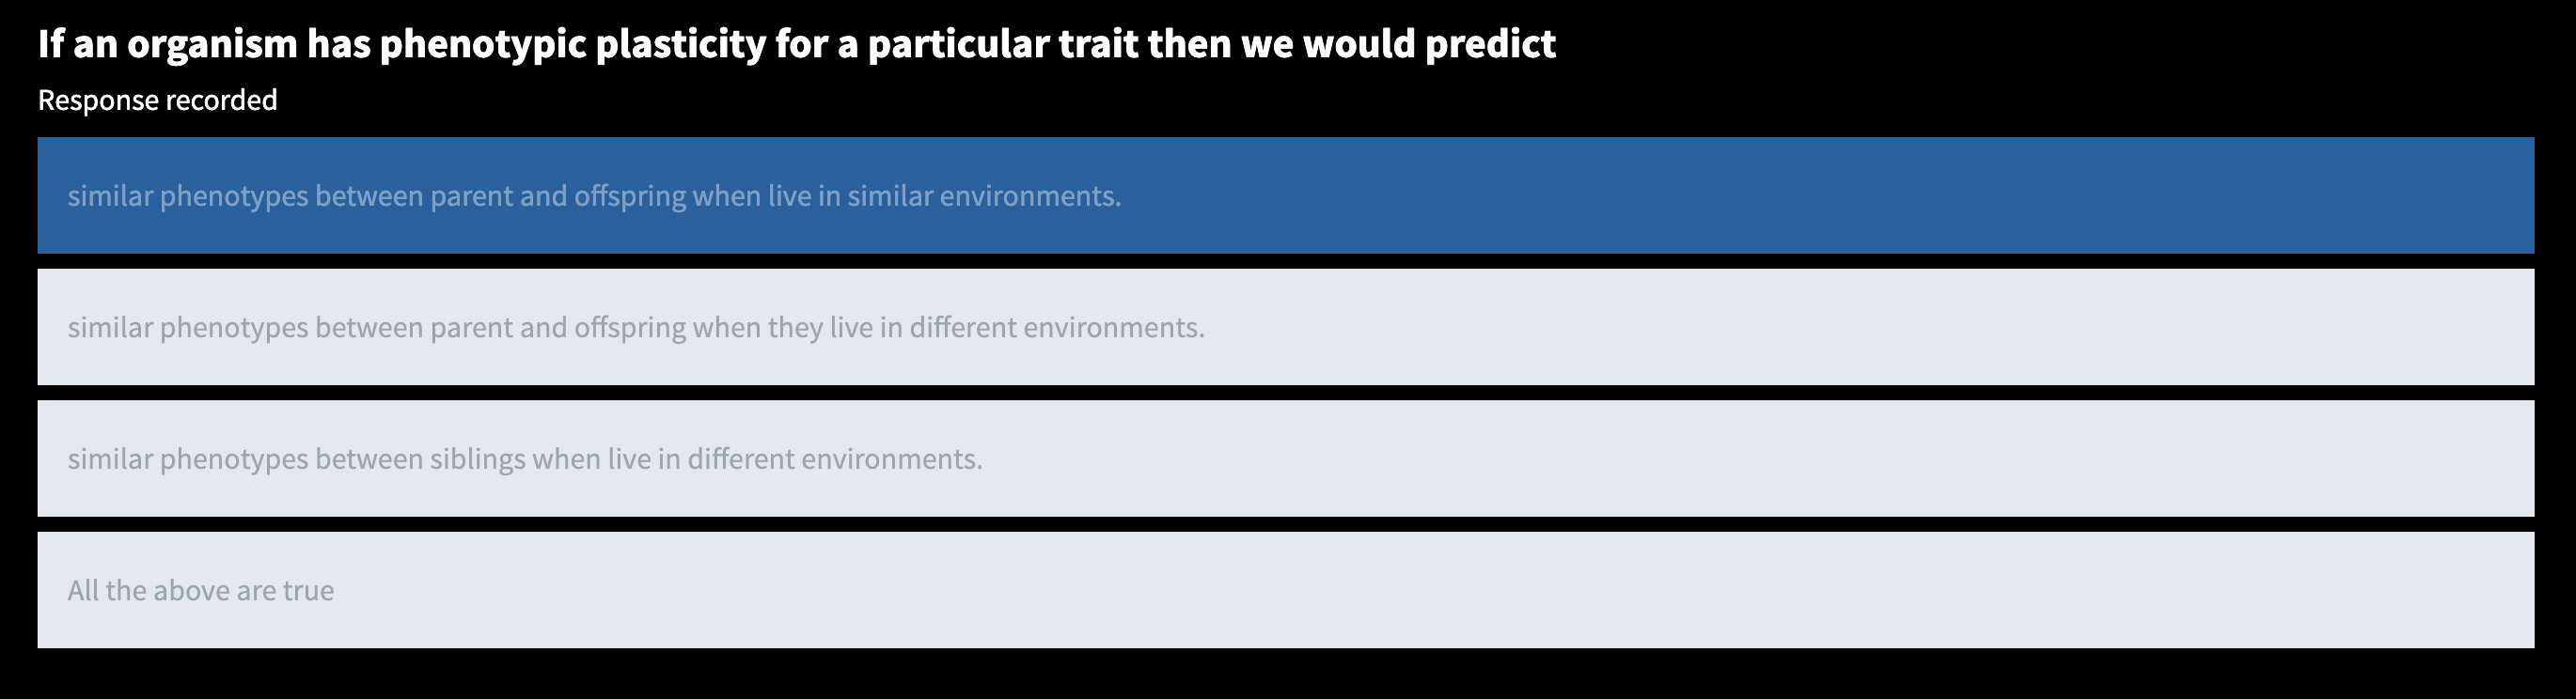
Phenotypic Plasticity is when a genotype produces various phenotypes for an organism during a single generation, this is not heritable
Evolution is the acquisition of traits and passing down the most favorable to offspring to increase fitness which causes changes in variation or adaptability, this is heritable
Characterize Sources of Genetic Variation
Point Mutations
Deletions, Duplications, Inversions
Chromosomal Mutations
Insertions
Crossing Over
Translocations
Describe Heritability of Alleles
Dominant alleles determine phenotype
Doesn’t mean the most common or adaptive
The Recessive allele is masked by the phenotype
Calculate Frequencies of Alleles Using Hardy-Weinberg Equation
p^2+2pq+q^2=1
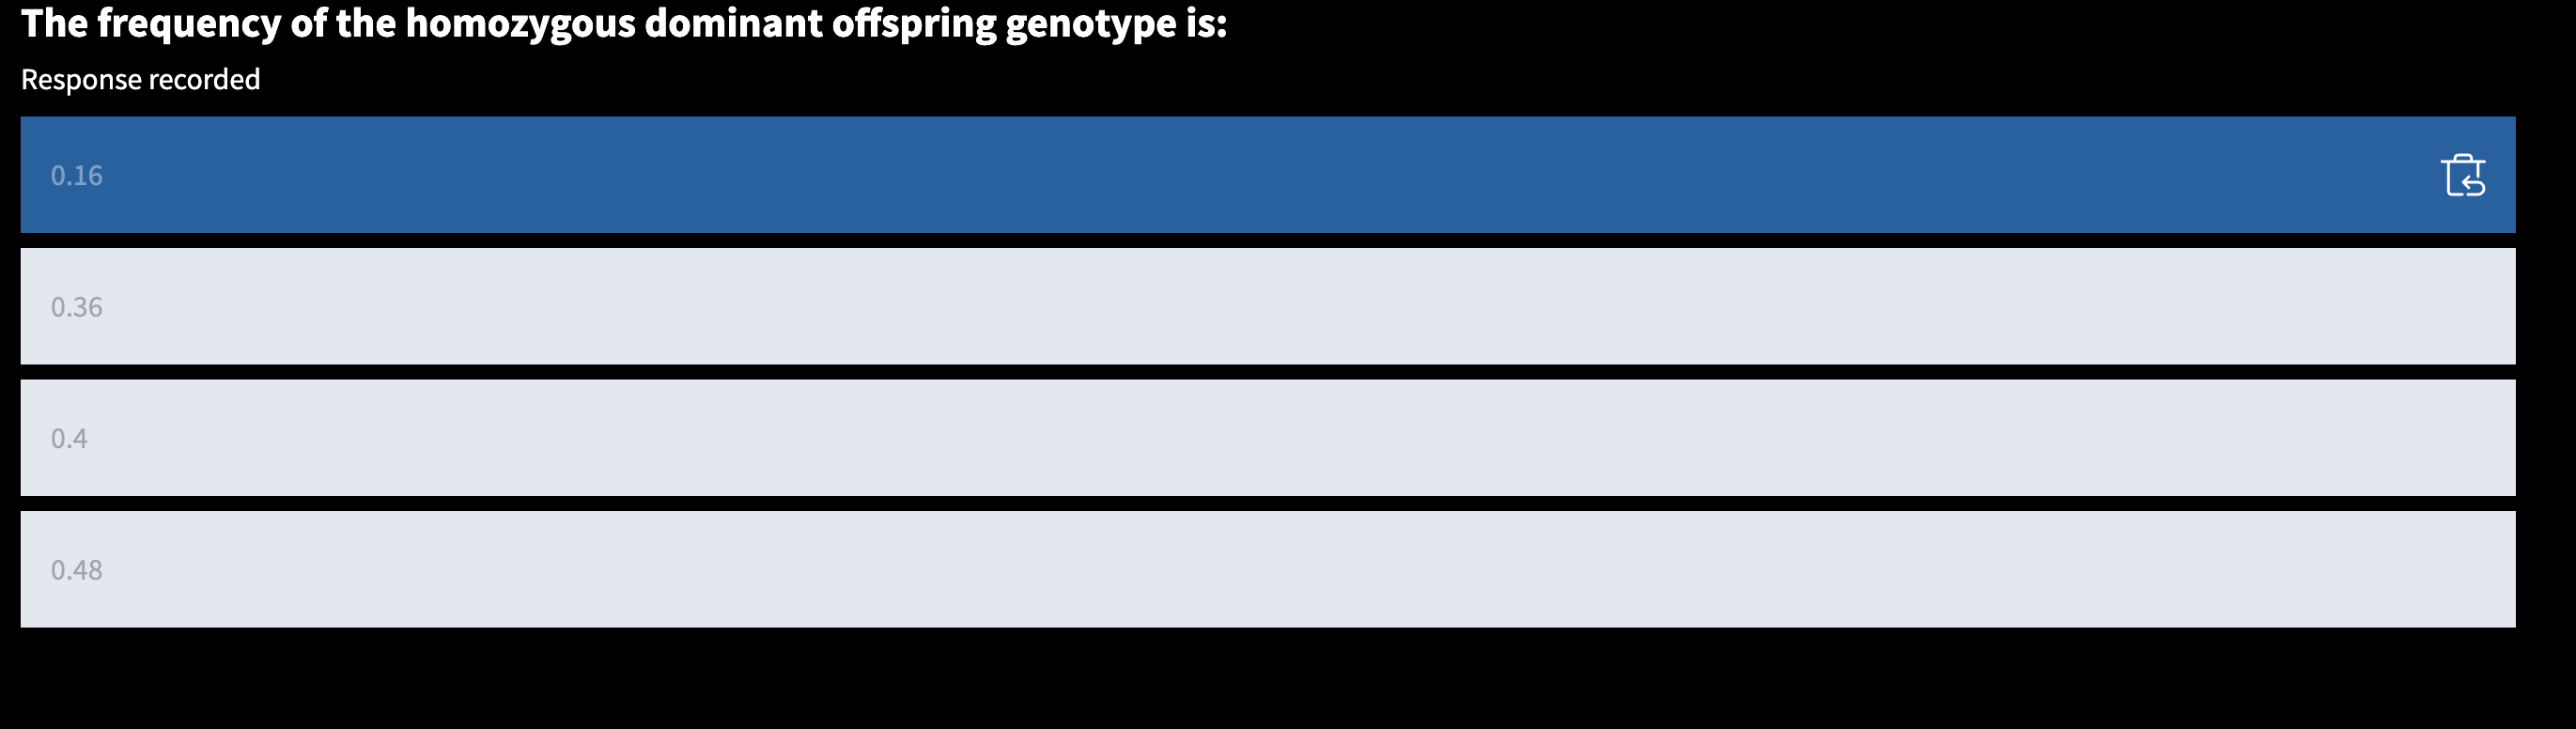
p^2 = A1= .7, A1 A1 = 49%
2pq= A1 A2 (heterozygous)= 42%
q^2 = A2= .3, A2 A2= 9%
Understand Assumptions of Hardy-Weinberg
It assumes that there won’t be any selection, mutation, migration, large populations, or random mating which is not plausible
Examine Hardy-Weinberg as a Null Hypothesis for Evolution
This equation only shows frequencies of alleles and genotypes in the absence of evolution
Deviations from the equilibrium indicate that one of the assumptions have been violated
PollEV
Page 3: Phenotypic Plasticity
Definition: Genotype produces different phenotypes depending on environmental responses, during single generation
Example: Variations in phenotype with different predator environments.
Heritability: The phenotype resulting from plasticity is not heritable
Environment drives phenotype not parental phenotype
Not all organisms have it
Page 4: Comparison: Phenotypic Plasticity and Evolution
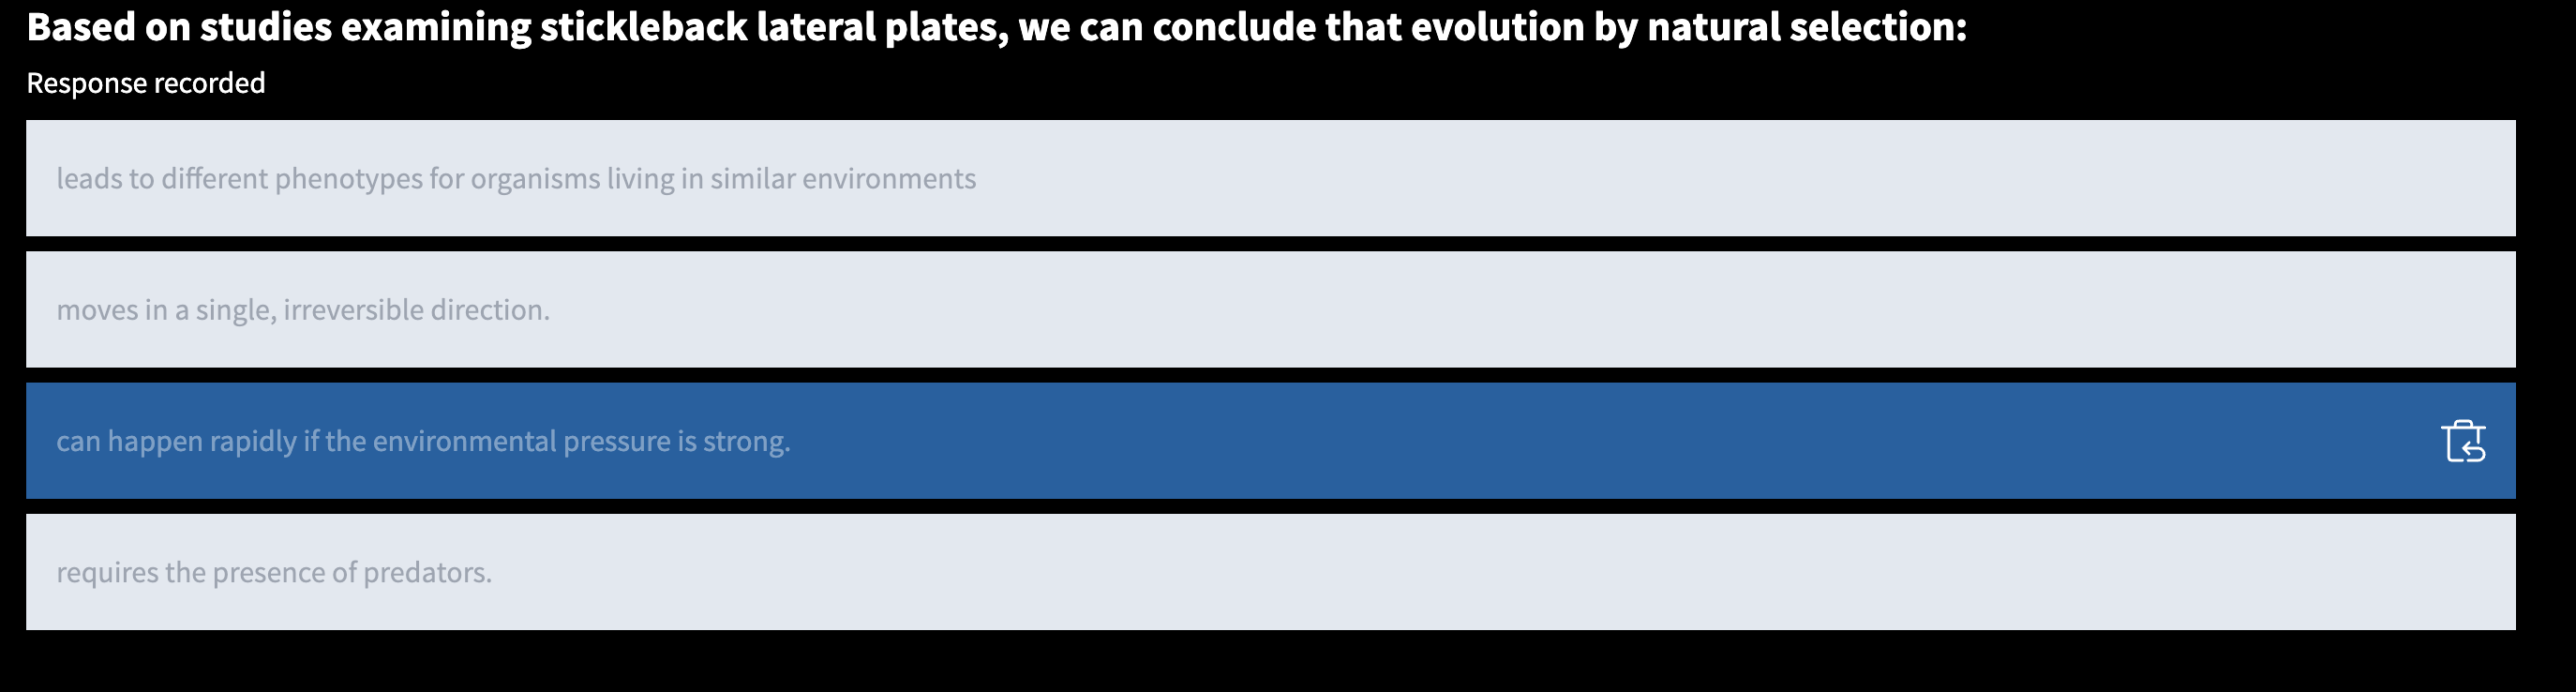
Responses to Predators: Observational comparisons between predator-present and predator-absent environments highlighting variations over generations.This demonstrates how phenotypic traits can adapt in response to selective pressures, leading to evolutionary changes that are distinct from those arising solely from genetic inheritance.
Page 5: Types of Phenotypic Plasticity
Forms of Plasticity:
Developmental: The environment you’re born in develops phenotype
Seasonal: In certain environments like summer or spring phenotypes can change throughout their lifetime
Page 6: Examples of Plasticity vs. Evolution
Chameleons changing color when moving is phenotypical plasticity
Page 7: Natural Selection
Commonality: Not all offspring survive.
Variation: Traits vary within a population; some traits may be heritable.
Fitness Advantage: Heritable traits that provide an advantage tend to become more common due to higher fitness.
Page 8: Genetic Variation
Definition: Differentiation among individuals in gene composition or DNA sequences.
Noteworthy Point: Genetic variation does not necessarily lead to observable phenotypic differences.
Phenotypic Plasticity vs. Genetic Variation: Not all phenotypic variation signifies genetic variation.
Page 9: Sources of Genetic Variation
Types of Variations:
Point mutations: random errors
Chromosomal mutations: insertions, inversions, deletions, duplications
Crossing over during meiosis: translocation
Page 10: Heritability in Genetics
Mendel's Observations: Noted inheritance patterns using pea plants demonstrating 3:1 ratio.
2 Alleles at a Locus:
Dominant: Determines the phenotype
Recessive: Masked in phenotype
Note: Dominance does not imply commonality or adaptiveness.
They can have incomplete dominance or co-dominance
Page 11: Mendelian Inheritance Example
Cross-Fertilization: between Purple and White parents leads to a uniformly purple F1 generation.
F2 Generation Ratio: 3:1 phenotypic ratio
Page 12: Population Level Genetics
Population Definition: A group of individuals of the same species, living in the same area and interbreeding leaving viable offspring
Alleles: Different gene variants (e.g., P/p, A1/A2)
Gene Pool: All copies of all alleles at every locus present within a population.
Evolution: Change in gene frequencies of a population over generations.
Page 13: Population-Level Approach
Example: A diploid population with 2 alleles.
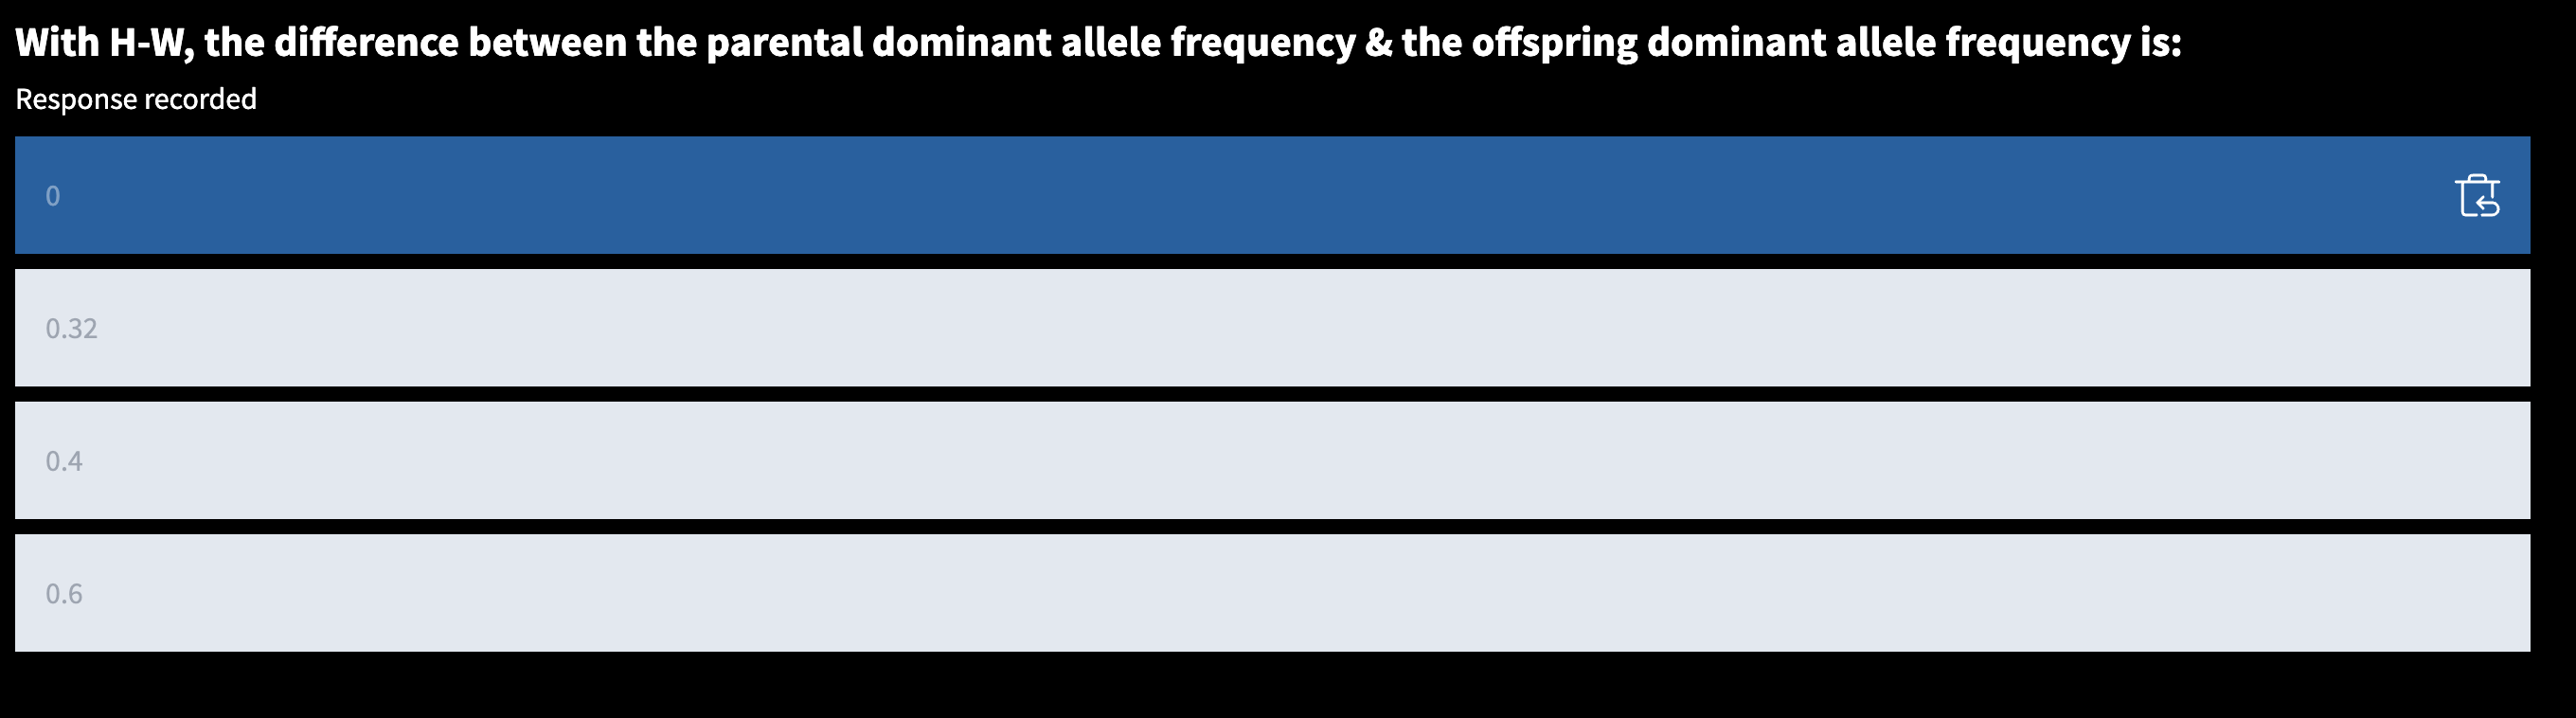
Hardy-Weinberg Principle: In absence of evolution, allele frequencies remain constant and do not change over time
Page 14: Hardy-Weinberg Equation Overview
Basic Principles:
Alleles A1 and A2 represented by frequencies p(dom) and q(rece.).
Evolution does not occur in populations in Hardy-Weinberg equilibrium.
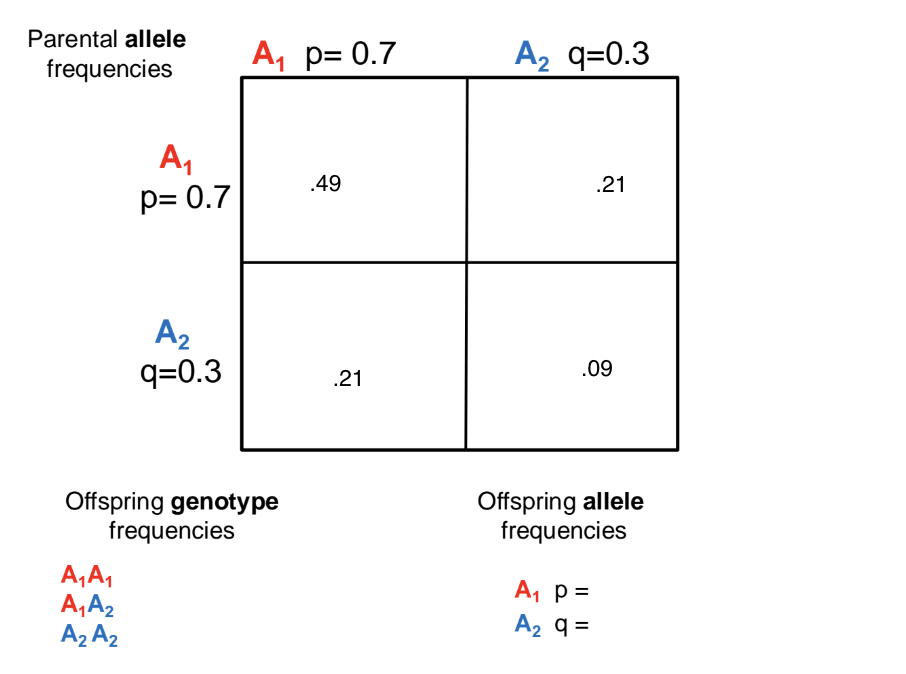
Page 15: Allele Frequency Calculation
Frequencies:
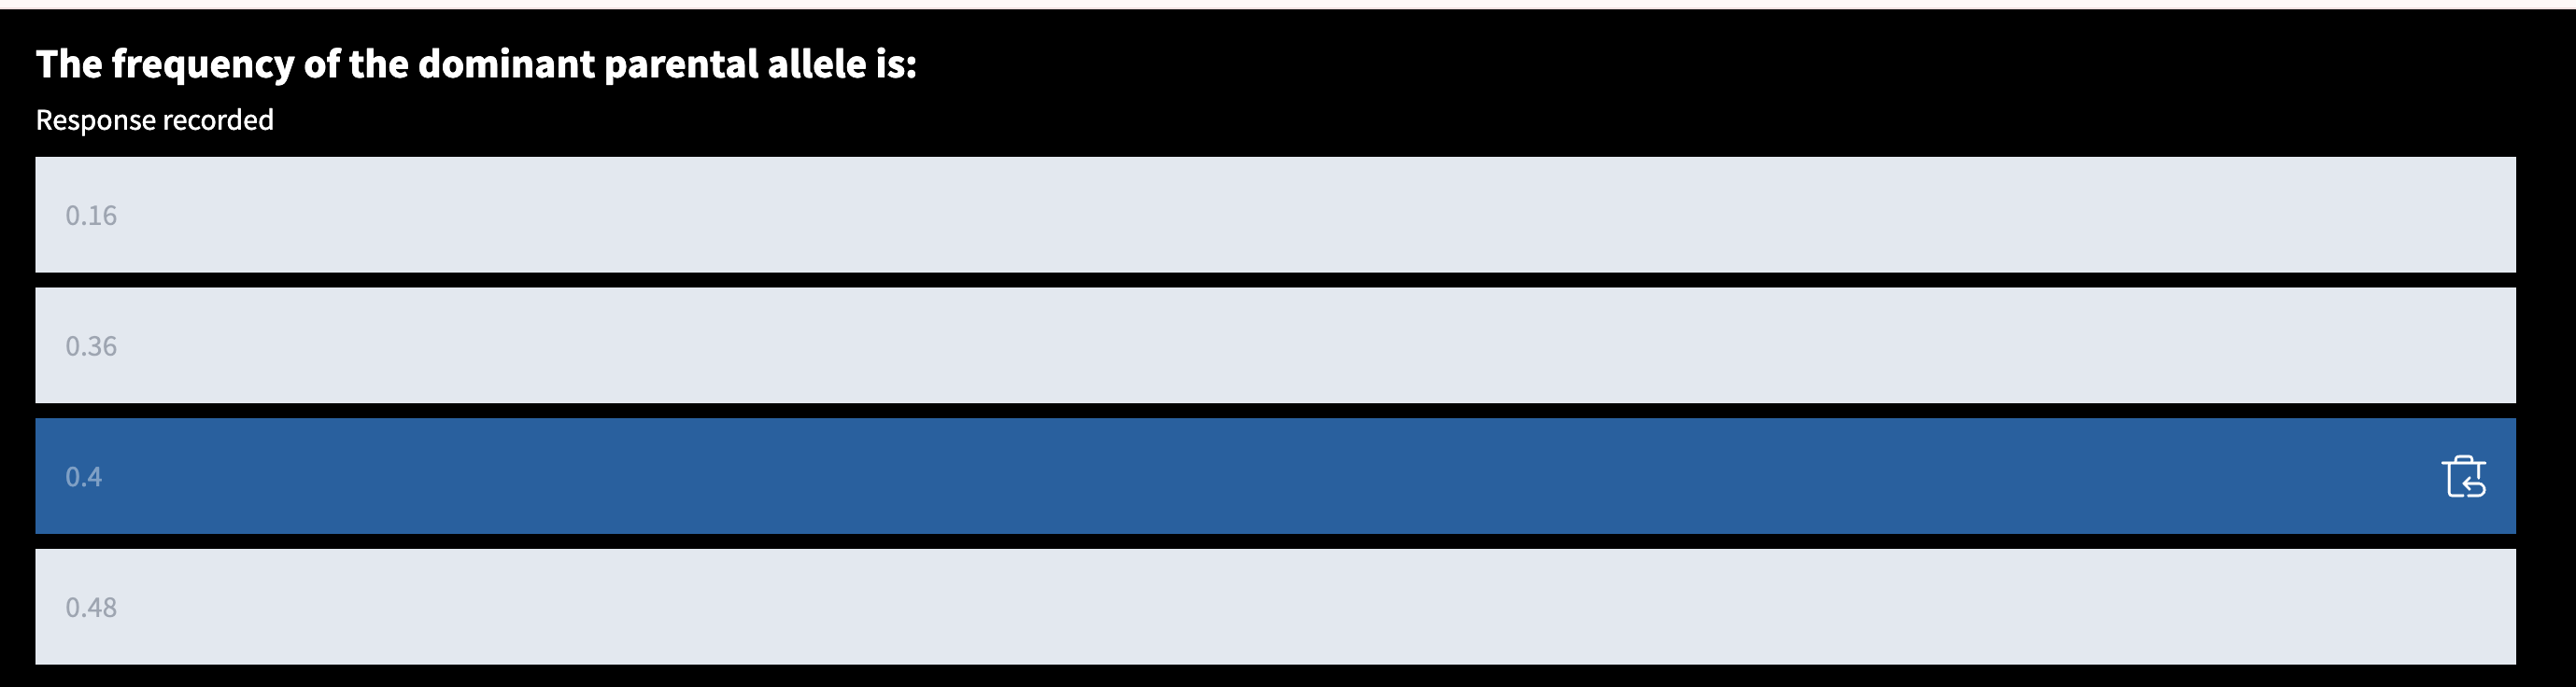
Dominant allele: A1 (p = 0.7)
Recessive allele: A2 (q = 0.3)
Genotypic Frequencies: Calculated using Hardy-Weinberg equation:
p² + 2pq + q² = 1
Page 16: Genetic Frequencies Continued
Parental Frequencies and Offspring Genotype Frequencies reiterated to ensure understanding of allele distribution (p and q).
Page 17: Assumptions of Hardy-Weinberg Equilibrium
No selection
No mutation
No migration
Large population size
Random mating
Page 18: Hardy-Weinberg in Practice
Example in Humans: MN blood-type allele frequencies.
Codominant alleles affecting phenotype.
Population Data: Observed frequencies from Caucasians and Aboriginal populations.
Page 19: More on Hardy-Weinberg Frequencies
Expected Genotype Frequencies: Comparison of observed frequencies in different human populations (Caucasians vs. Aborigines).
Page 20: Assessing Hardy-Weinberg Equilibrium
Equilibrium Status: The population is in Hardy-Weinberg equilibrium if genotype frequencies match expected frequencies derived from allele calculations.
Page 21: Hardy-Weinberg as a Null Hypothesis
Null Hypothesis: Establishing baseline frequencies of alleles and genotypes in the absence of evolutionary change.
Deviation Interpretation: Indicates a violation of assumptions possibly leading to evolutionary mechanics.