NORMAL ECG_24110
Basic Principles of ECG
An electrocardiogram (ECG) is a recording of the heart’s electrical activity as it spreads through body fluids and reaches the body surface. It's not a direct measure of the electrical activity inside the heart but a summation of all heart muscle cells' electrical activities.
ECG captures the depolarization (excitation) and repolarization (return to resting state) phases of the cardiac cycle.
Heart Conduction System
Sinoatrial (SA) Node: The primary pacemaker of the heart, located in the right atrium, which initiates the heartbeat by rapidly firing impulses.
Pathway of Conduction:
SA Node (70-80 APM) discharges, creating the initial signal.
Signal spreads through internodal pathways to the Atrioventricular (AV) Node.
AV Node(40-60 APM) : Brief delay here allows for ventricular filling before impulse passes on.
Bundle of His(20-40 APM) and branches then transmit the impulse to both ventricles.
Purkinje Fibers(20-40APM) spread the signal throughout the ventricles, resulting in synchronized contraction.
ECG Wave Components and Interpretation
Deflection Directions: On the ECG trace, a positive deflection is above the baseline, and a negative deflection is below. This reflects the direction of the electrical impulse relative to the recording electrode.
Magnitude of Deflections: The vertical amplitude of the waves reflects the voltage of the signal, typically measured in millimeters on ECG paper.
Main Waves and Intervals:
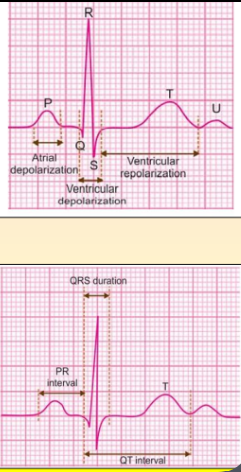
P Wave: Represents atrial depolarization.
QRS Complex: Represents ventricular depolarization. It has three components:
Q wave: Initial downward deflection.
R wave: Upward deflection following the Q wave.
S wave: Downward deflection following the R wave.
T Wave: Represents ventricular repolarization.
U Wave (if present): May represent repolarization of the Purkinje fibers or afterpotentials in the ventricles.
Key Intervals and Segments:
P-R Interval: From the start of the P wave to the start of the QRS complex; indicates the time taken for the electrical impulse to travel from the atria to the ventricles through the AV node.
Q-T Interval: From the start of the Q wave to the end of the T wave; represents the total time for ventricular depolarization and repolarization.
P-R Segment: Represents AV nodal delay (flat portion after the P wave).
S-T Segment: Flat portion after the QRS complex, indicating the plateau phase of ventricular depolarization.
ECG Interpretation of Heart Rate and Rhythm
Heart Rate (HR): Determined by counting the number of R-R intervals in a 60-second period.
Method for Regular Rhythm:
Divide 300 by the number of large squares between consecutive R-R waves.
Alternatively, divide 1500 by the number of small squares between R-R waves.
Method for Irregular Rhythm: Count the QRS complexes in 30 large squares (6 seconds) and multiply by 10 to approximate beats per minute.
Normal Heart Rate Range: 60-100 bpm.
Bradycardia: HR < 60 bpm.
Tachycardia: HR > 100 bpm.
Normal Sinus Rhythm (NSR)
Characteristics of NSR include an upright P wave, a normal P-R interval, and narrow QRS complexes. In NSR, the interval between each beat is equal (regular spacing of QRS complexes).
Clinical Applications of ECG
Abnormal Heart Rates:
Sinus Tachycardia: Heart rate >100 bpm. Common causes include exercise, fever, and hyperthyroidism.
Sinus Bradycardia: Heart rate <60 bpm. Causes may include high fitness levels (e.g., in athletes), hypothyroidism, jaundice, or certain medications.
Arrhythmias and Rhythm Abnormalities:
Ventricular Tachycardia: A rapid heart rhythm originating from the ventricles, usually with a rate between 150-200 bpm.
Atrioventricular (AV) Block: A condition where the signal is delayed or blocked at the AV node, resulting in impaired conduction from atria to ventricles.
Ischemia and Myocardial Infarction:
ECG can detect signs of ischemia (reduced blood flow) or infarction (heart muscle damage) based on changes in waveforms and segments, such as the S-T segment and Q-T interval.
QRS Axis Deviations:
Right Axis Deviation: Often associated with a thin, tall body type, chronic lung disease, or right ventricular hypertrophy.
Left Axis Deviation: May be seen in obese individuals, those with left ventricular hypertrophy, or inferior wall infarction.