Bradford Assay Analysis
Data/Results:
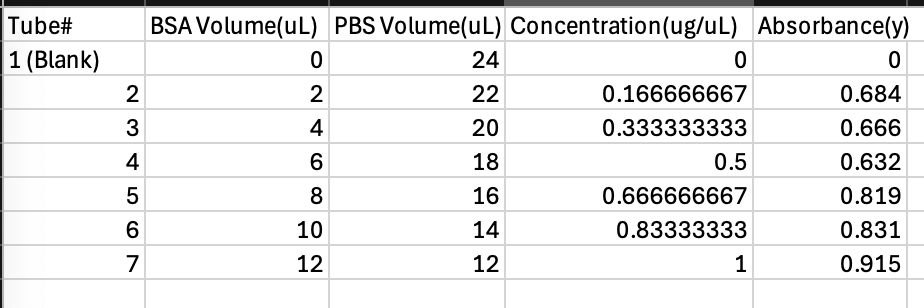
Table 1. Test Tube Content BSA + Absorbance and Concentration.
Graph 1. BSA Standard Curve (Concentration vs. Absorbance)
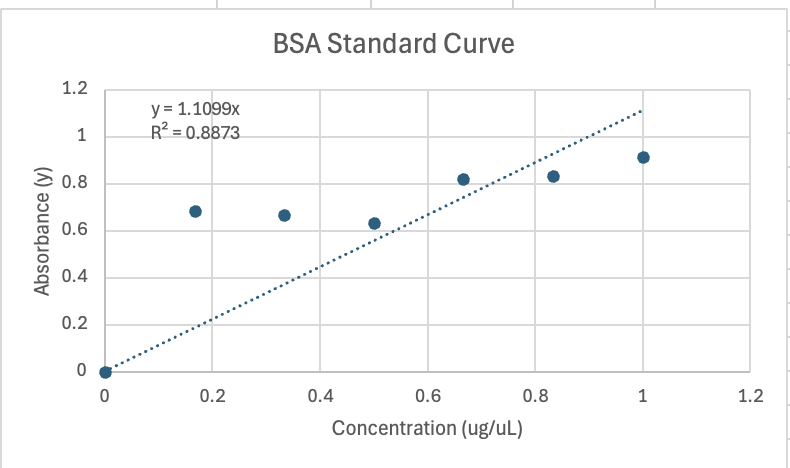
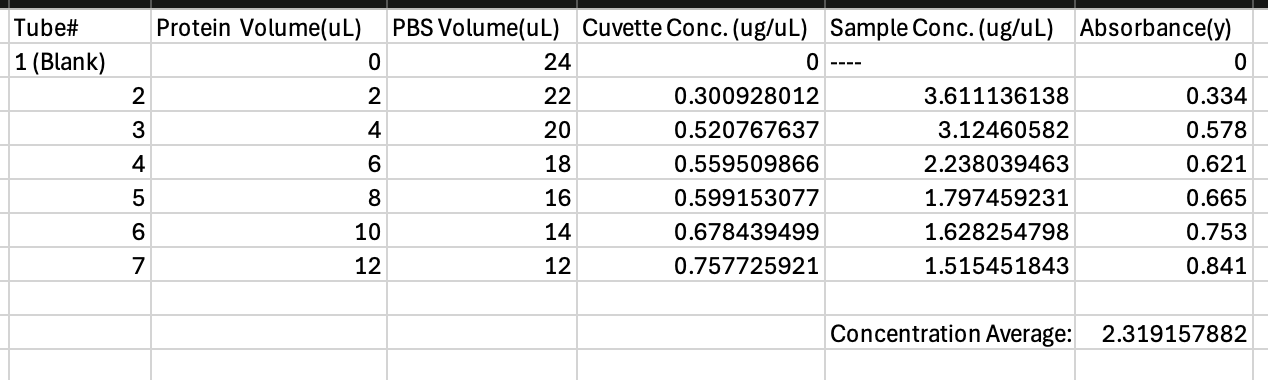
Table 2. Test Tube Content Unknown Protein 3 + Absorbance and Concentration.
Calculations:
Concentration calculation of BSA was obtained through the formula c1v1 =c2v2.
The final volume for each test tube is 24uL. The initial volume is the BSA volume added ie. test tube 2 has a initial volume of 2uL. The initial concentration is 2ug/uL, therefore with this C2 can be calculated.
Once the concentration for each test tube for BSA was calculated and the absorbance was collected via spectrophotometry, the values were plotted on excel scatter plot to form the BSA standard curve shown in Graph 1.The best line of fit is the standard curve. The graph shows the relationship between absorbance and concentration for BSA. The trend line was generated in order to compute the equation of y=1.099x. y is the absorbance value and x is the concentration of the protein in each cuvette.
The linear trend line equation produced, y=1.099x, was used to compute the concentration of c2 for unknown protein 3. The value of each test tube’s absorbance as shown in Table 2. was inputed as the y value in the equation to calculate for x which will determine the final concentration of the sample, c2.
The dilution factor c1v1=c2v2 to determine the initial concentration of the unknown protein. Each dilution’s c2 was calculated from y=1.099x. Each cuvettes dilution factor was calculated and shown in Table 2.
Results:
The expected results were that the first test tube’s initial absorbance for BSA and the unknown protein were to be zero. Since the concentration of the BSA and unknown protein is increasing with each dilution then the absorbance as well will show a increase. Test tube 7 will have the highest absorbance value. The average for the concentration should be around 1.5 .
Once the experiment was ran through, the data collected for the first cuvette matched the expected results of having an absorbance of 0. Although for the BSA dilution the absorbance did overall increase but cuvette 2-4 did not increase as expected. This is believed to be due to pipetting error, there could have been more concentration in some cuvettes than the others therefore explaining why the absorbance in cuvette 2 is higher than 3 and 4. There as well could have been errors in measurement when pipetting the PBS and Bradford reagent. After reagent 4 the increase of absorbance was as expected. Absorbance of the the unknown protein went as expected and increased with each dilution. The concentration for the unknown protein place at 2.319. This differs from the expected which as would have resulted from pipetting errors as well ass improper mixing of the solution. Another issue could have come from bubbles being picked up while pipetting that disrupts the volume.
If the experfiment were to be repeated, the clibration of the micropipetteers were to be done. As well as relearn proper pipetting technique to ensure that there is no bubbles being obtained from pipetting the solution and distubring the volume. Gently mixing all of the solutions would as well be done before taking the aborbance to ensure even distribution.
Discussion:
The goal of this expeiment was to determine the concentration of the unknow protein through comparrsion of the BSA concentration and aborbance through Bradford Assay. Plotting a standar cuve of BSA allowed to find the concentration of the unknow which then was used to find the inital concentraiton. As stated in the protocol, the concentration of the unknow was determined through the dilution process and comparison with BSA. The Bradford Assay method allowed for the sucessful detmeriniation of the unknown protein cocnetration through the plotting of the BSA concentration vs abroabcnce. This equation, line of best fit, then was used to detemrine the final concentration of the unknown protein which then allowed the equation c1v1=c2v2 to be used to figure out the intial. Some protien errors caused to stray from the expected results but overall the resutls supported the hypothesis that the concentration of the unknown was to be dtemriend nthrough the dilution process and comparision with BSA.
The blank cuvette for the BSA and unknown dilutions were used as the control. The abosbramnce for recordered as 0 in Table 1. and Table 2. allowed to zero out the background to report the rest of the dilutions values. The blanks as well reasurred that the dilutions started at zero and were able to use as a comparison and as a negative control. It revealed what the absorbance is to be expected if there is no concentration. Another control was the BSA itself to allow the estimation of the concentration of the unknown protein through the standard curve. The dilution factors as well for both BSA and unknown protein allowed the effecitve comparision.
From the data and results the expected average for the unknown protein was to be around 1.5 although the data revealed 2.3. This could have been due to errors in pipetting and mixing the solution. Bradford assay allowed to the concentration of each dilution of the unknown protein to be obtained through the usage of the BSA standard curve that measured aborabnace vs concentration. Although there were errors in pipetting as shown in the aborbance of Table 1., the overall experiment was sucessful regardless of human errors.
The next experiment involves the usage of SDS Page analysis that will allow us to determine the size of the unknown protein. It is a common method that uses high resolution to seperate a mixture of proteins. The way it is done is thorugh the denaqturing of protein that will go through electgrophoresis. Buffers using SDS and DME arfe used to sperate the protein and allow the sepreation. The blue-native (BN)-PAGE is used to perservate the stsructure and function of the protein. The weight of the protein itself will then be seen on the gel electorphoresis though coomassi blue stain.