W8 - Accommodation Vergence relationship
Analytical approaches (overview)
There are multiple approaches to analyse accommodation and vergence clinical data.
Goals across approaches:
Diagnose binocular vision dysfunctions.
Confirm normal binocular function after clinical assessment.
Approaches include:
Graphical analysis
Analytical analysis
Morgan’s normative analysis (normative analysis)
Fixation disparity analysis
Integrative analysis approach (framework of this course)
Each approach uses different data representations and decision rules, often complementing one another in clinical decision-making.
Graphical analysis
Purpose: Plot clinical accommodation and vergence findings to determine whether the patient has clear, single, comfortable binocular vision.
Clinical measures commonly plotted:
Dissociated phoria
Negative fusional vergence (BI): blur/break/recovery
Positive fusional vergence (BO): blur/break/recovery
Negative relative accommodation (NRA)
Positive relative accommodation (PRA)
Amplitude of accommodation
Amplitude of vergence (calculated using near point of convergence (NPC) and PD)
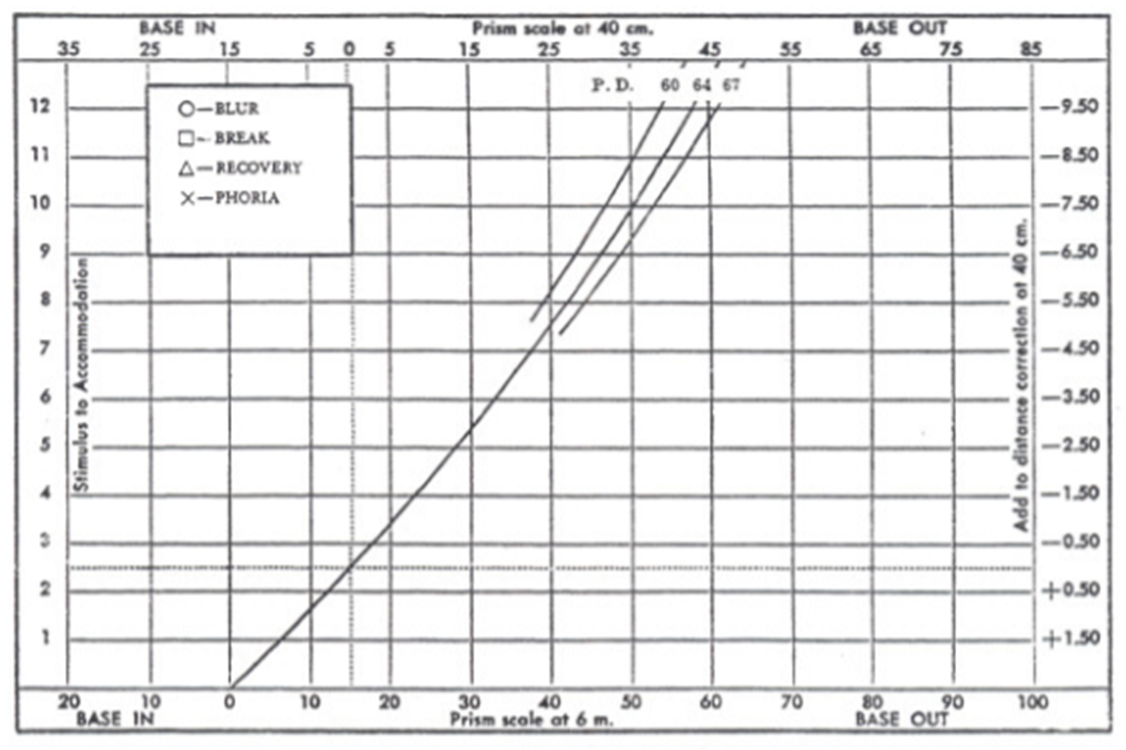
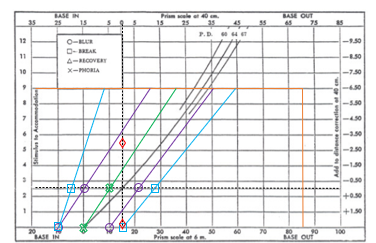
Distance scale at bottom, near scale at top.
40cm working distance at 0 vergence demand.
Cross is accommodative demand (2.50D)
Visual representation: x-axis = vergence (Δ); y-axis = accommodative stimulus (D).
Coordinate mapping:
Vergence at 6 m is on the bottom axis; vergence at 40 cm is on the top axis.
Accommodative stimulus (D) on the y-axis.
Reference lines and lines:
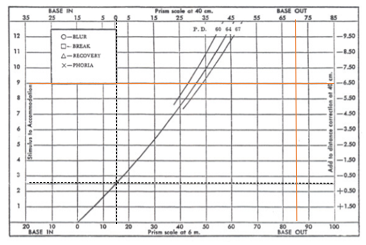
Horizontal dotted line at 2.50 D accommodative stimulus (corresponding to 40 cm = 1/0.40 m).
Vertical dotted line at 15 Δ BO (convergence demand at 40 cm with PD = 60 mm, i.e., 6.0/0.40 = 15 Δ).
Demand line (bold curved line) showing combined accommodative and convergence demand across levels of accommodative stimulus.
Orthophoria at all working distances along the demand line when aligned with the visual axes.
Key plotted data points (examples from slides):
Dissociated phoria
BO (base-out) blur/break/recovery
BI (base-in) blur/break/recovery
NRA/PRA
Amplitude of accommodation
Amplitude of vergence (via NPC and PD)
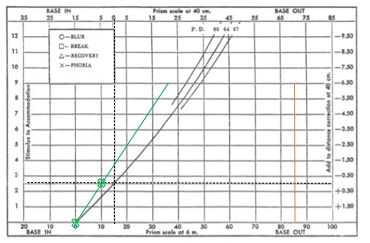
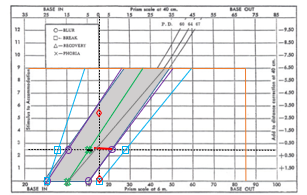
Graphical analysis – procedure (stepwise)

Step 1: Plot amplitude of accommodation and amplitude of convergence.
Amplitude of accommodation = AA=\frac{1}{\text{NPA}}
Example: if NPA = 11 cm = 0.11 m, then \text{AoA} = \frac{1}{0.11} = 9\,\text{D}
Amplitude of convergence = A_{conv} = \left(\frac{1}{NPC}\right) \times PD
Example given: NPC = 7 cm (0.07 m), PD = 6 cm; A_{conv} = \left(\frac{1}{0.07}\right) \times 6\text{ cm} \approx 86\Delta
70-90 is the common range.
Step 2: Plot distance and near phorias.
Connect with a straight line and extend the line to the amplitude of accommodation line.
ORTHO is bottom scale
base in = exo
base out = eso
near working distance - plot point at 40cm working distance line (horizontal dotted line).
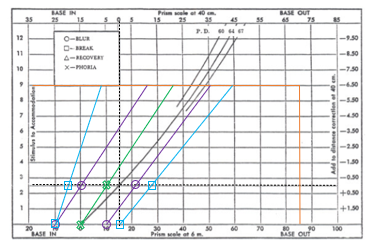
Step 3: Plot BO to blur / break findings.
Connect with a straight line and extend to the amplitude of accommodation.
Plot BO to break findings similarly.
repeat for distance and near
Step 4: Plot BI to blur / break findings.
Connect with a straight line and extend to the amplitude of accommodation.
If there is no blur point, draw the line through the break finding.
Plot BI to break findings analogously.
repeat for distance and near
Step 5: Plus lens to blur finding (NRA).
Represents the limit of positive fusional vergence as plus is added.
Should line up with the BO to blur finding.
Step 6: Minus lens to blur finding (PRA).
Represents the limit of negative fusional vergence.
Generally, does not line up with the BI to blur finding due to minification effects of minus lenses.
Graphical analysis – interpretation
Zone of clear, single binocular vision (BSV):
Bounded by BI and BO to blur lines.
clear zone - purple lines on graph
NRA/ PRA line to be in the centre
zone of binocular vision - blue lines on graph
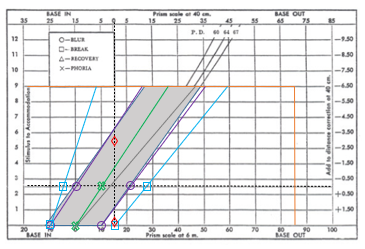
Zero accommodative stimulus line marks alignment with the baseline.
The line representing amplitude of accommodation sets the top boundary.
Zone height depends on AoA (amplitude of accommodation).
Zone width depends on the amplitude of fusional vergence (positive and negative) at corresponding accommodative stimulus levels.
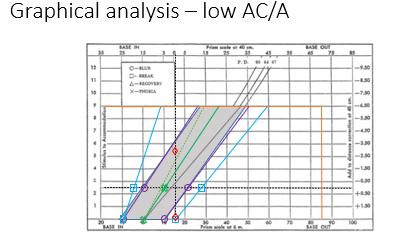
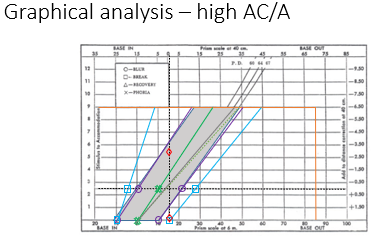
Accommodative convergence (AC/A) relationship:
Indicated by the slope of the phoria line.
Steeper slope => lower AC/A ratio; flatter slope => higher AC/A ratio.
AC/A ratio considerations:
Low AC/A: smaller change in vergence for a given accommodation change; potential for convergence insufficiency or accommodation-driven issues.
High AC/A: larger vergence change per diopter of accommodation; potential for convergence excess or accommodative problems influencing vergence.
Percival’s criterion (PC):
Demand line should lie in the middle third of the zone of clear, single BV.
If not, there is an increased risk of asthenopia.
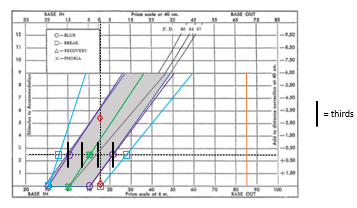
Sheard’s criterion:
Compensating vergence reserve should be about twice the initial phoric demand.
If not, there is an increased risk of asthenopia.
green point to vertical dotted by dotted to purple.
Advantages of Graphical Analysis:
Helpful for understanding relationships between individual parameters
Width of zone of clear BSV and zone of BSV
Relationship between phoria and fusional reserves
Relationship between NRA/PRA and fusional reserves
Limits imposed by NPA and NPC
AC/A ratio
Disadvantages of graphical analysis:
Doesn’t cover key parameters
Accommodative posture
Accommodative facility
Vergence facility
Fixation disparity
These are covered in integrative analysis approach
Cumbersome and time consuming
Usefulness limited to consolidate your understanding of binocular vision, through visually representing data
Analytical analysis
Developed by OEP (optometric extension program)
21-point examination with precise instructional sets
clinical findings are then compared to a table of expected findings
data is grouped and conditions identified
Limitations
rigidity of 21 point examination
must be familiar with specific OEP protocols; requires further study / training
OEP has different definitions for accommodation, convergence, phoria etc.
Morgan’s normative analysis (Normative analysis)
Developed approach by Morgan; also called normative analysis.
Core idea: treat results as group data, not single-point deviations.
Procedure:
Compare individual findings to Morgan’s table of expected findings.
Look for a trend across Group A and Group B findings.
If a group, as a whole, varies in a given direction, it is clinically significant.
Group data descriptions:
Group A data: distance NFV (break), near NFV (blur/break), near NFV (break), PRA, AoA.
Group B data: distance PFV (blur/break), near PFV (blur/break), binocular + monocular fused cross-cylinder, NRA.
Group C data: Phoria, AC/A ratio
Interpretive rules:
If Group A findings are high and Group B findings are low: suggests a convergence problem.
If Group A findings are low and Group B findings are high: suggests accommodative fatigue.
Group C findings help decide whether lenses, prism, or vision therapy should be recommended.
Limitations:
Does not account for accommodative facility, vergence facility, fixation disparity.
Fixation disparity - revision
Occurs in binocular single vision
Image is seen singly despite slight under/over convergence of visual axes, when disparate retinal points are WITHIN Panum’s area
Manifest deviation of the eyes
Generally <10 mins of arc (always less than 1 PD / 30 mins of arc)
Measured with Sheedy disparometer, Wesson card
Aligning prism/associated phoria = amount of prism required to reduce fixation disparity to zero (correct misalignment)
Occurs within Panum’s fusional area (no diplopia)
Measured with Mallett unit, Bernell lantern
Fixation disparity analysis
Fixation disparity curves are generated
As vergence demand is altered, fixation disparity may change
Plot fixation disparity in 3\Delta increments (both BI then BO, until diplopia)
Typically, an increase in BO increases exo fixation disparity and an increase in BI increases eso fixation disparity
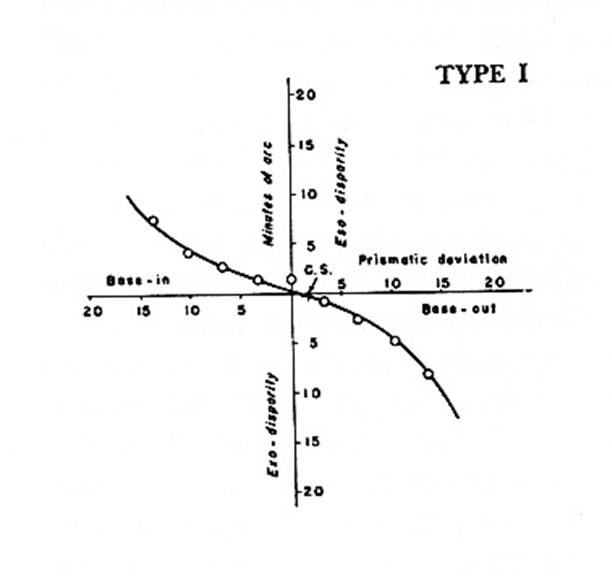
Four diagnostic characteristics of curve are analysed:
Type
Slope
x-intercept
y-intercept
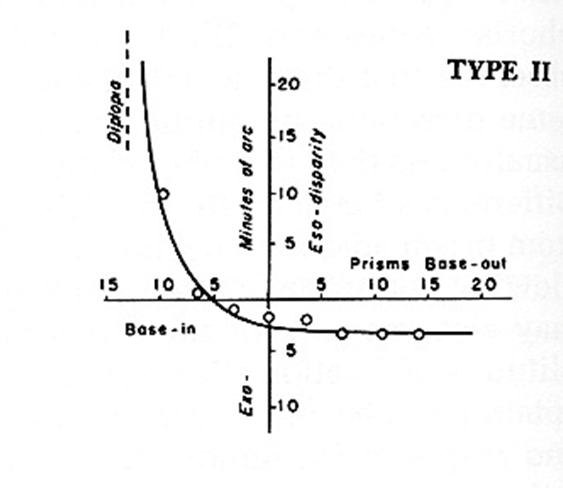
Curve type (Fixation disparity curves)
Curve type reflects how the system adapts to prism demands
Generally adapt more in one direction (BI or BO) than the other; variations determine curve shape (type)
Type I = equal adaptation to BI and BO; asymptomatic
Type II = more adaptation to BO prism, less adaptation to BI prism
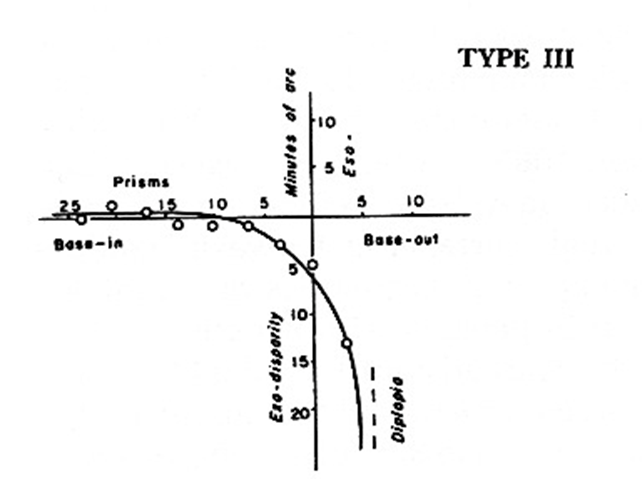
Type III = more adaptation to BI prism, less adaptation to BO prism
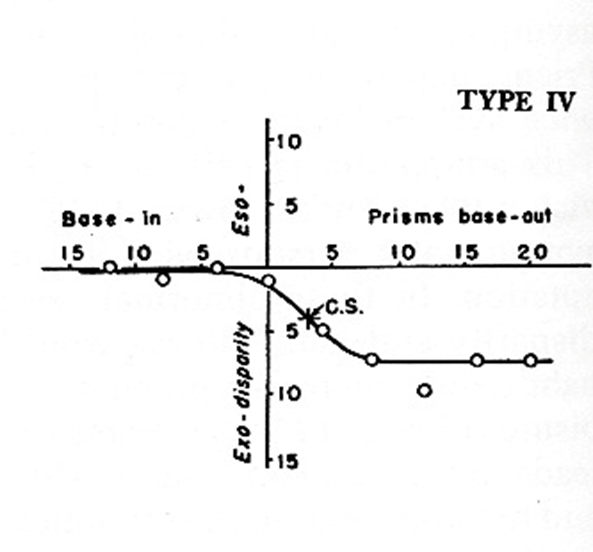
Type IV = unstable binocularity
Type I curve
Type I = 60% of population
x- and y-intercept = 0
Vision therapy has best prognosis
Type II curve
Type II = 25% of population
‘Eso’-curve (but not always)
Prism has best prognosis
Type III curve
Type III = 10% of population
‘Exo’-curve (but not always)
Prism or vision therapy (fusional reserves) may be useful
Type IV curve
Type IV = 5% of population
Unstable findings
Strong tendency to prism adapt
Poor prognosis
SHELLY SAYS DON’T SPEND A LOT OF TIME UNPACKING THIS - she skipped over it in the lecture.
Curve slope
Estimated by determining change in fixation disparity between prism demands of 3\Delta BO and 3\Delta BI
Flat fixation disparity curves:
Prism is effective at shifting centre of symmetry (middle of flattest portion) towards y-axis
Reduces symptoms, improving binocularity and allows lower prism than dissociated/associated phoria measures
Steep fixation disparity curves:
Treat with vision therapy
If curves do not flatten with vision therapy, prism may be prescribed based on associated phoria
x-intercept (associated phoria) and y-intercept (fixation disparity)
x-intercept = associated phoria; prism amount to reduce fixation disparity to 0
Use of only lateral associated phoria for prism prescribing is not adequate
Need to consider slope, curve type and fixation disparity
Otherwise, can overestimate prism corrections for esodeviations
Guideline: for horizontal prism in esodeviations, start with \frac{1}{3} of distance phoria, then assess vergence ranges, associated phoria, and stereoacuity
y-intercept (fixation disparity) = small misalignments of visual axis under binocular conditions
y-intercept (fixation disparity)
Small misalignments of visual axis under binocular conditions
Fixation disparity measurements are generally not measured clinically
Common clinical tools: Wesson card, disparometer
Advantages of fixation disparity analysis
Clinical measures are taken under binocular conditions (more natural)
Useful in determining which patients are likely to have symptoms
Guides to optimal management strategy (prism or vision therapy)
An effective method for determining the amount of prism to prescribe
Disadvantages of fixation disparity analysis
Does not provide direct measures of accommodation or ocular motility
Integrative analysis
Three distinct steps:
Compare individual tests to a table of expected findings
Group findings that deviate from expected findings
Identify syndrome/condition
Similar concept to analytical analysis but without the rigidity of the 21-point clinical tests
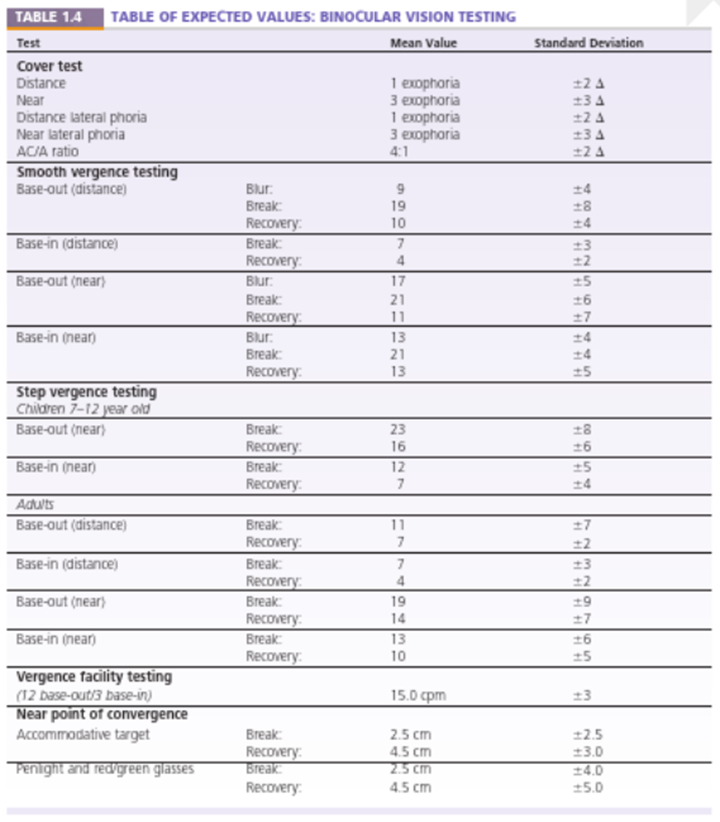
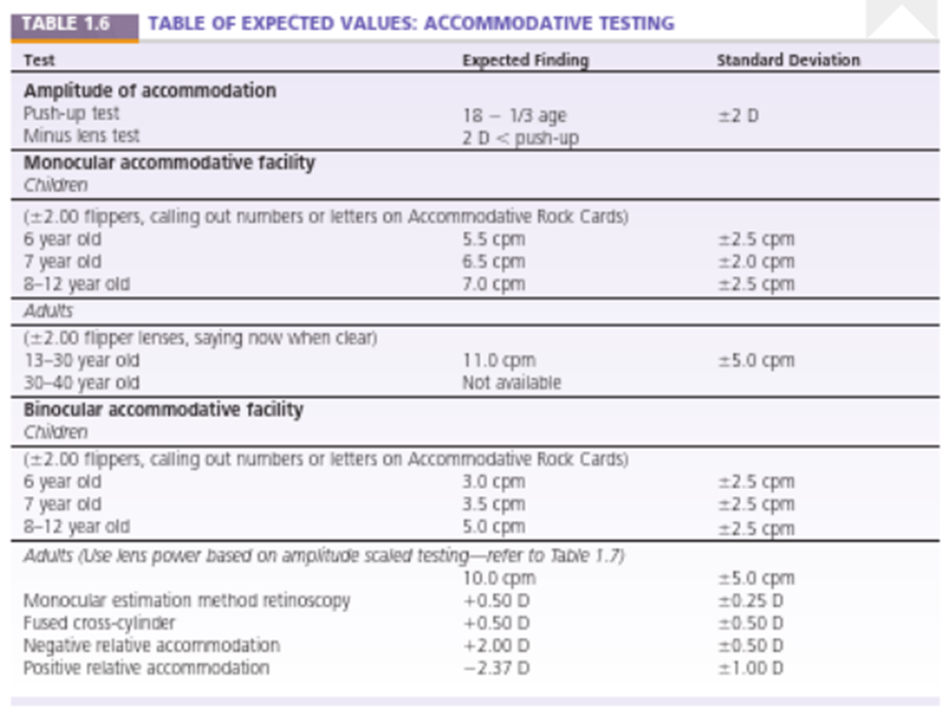
Integrative analysis - expected findings (overview)
Tables of expected values cover binocular vision testing and accommodative testing
Tests include: cover test, lateral phoria, AC/A ratio, smooth vergence, base-out/in; break/recovery/blur values; vergence facility; NPC; MEM; FCC; accommodative tests
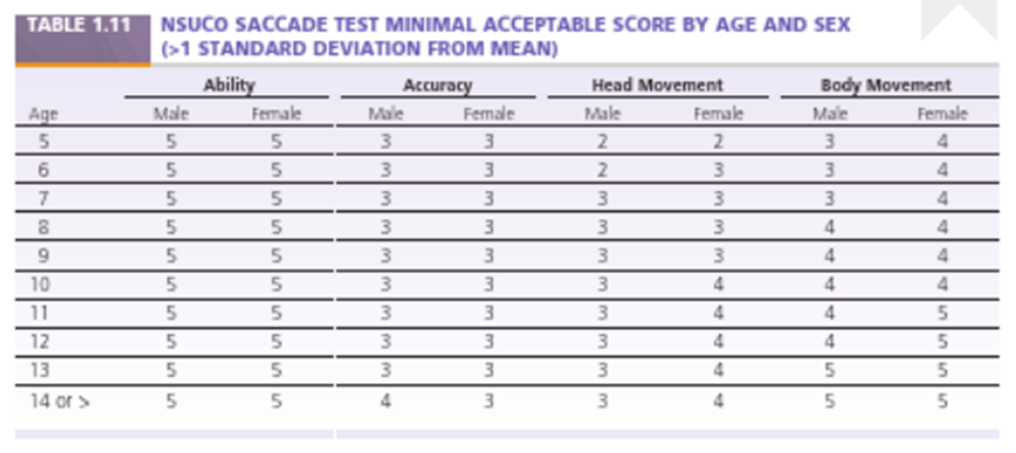
Important to consider both mean values and standard deviations (SD) when interpreting resultsIntegrative analysis - expected findings: NSUCO SACCADE TEST minimal acceptable score by age and sex
Provides age- and sex-specific normative scores for accuracy, head movement, and body movement during saccades
Used to evaluate ocular motor function as part of integrative analysis
Scores decline with age; differences exist between sexes in some categories
Integrative analysis – grouping data
Data are grouped into 6 test groups:
Positive fusional vergence (PFV)
NPC
NRA
positive fusional vergence
Negative fusional vergence (NFV)
PRA
minus lenses for binocular accommodative facility
Accommodative system
Vertical fusional vergence
Ocular motor system
Motor alignment and interaction test
Integrative analysis – PFV group data
PFV components included:
PFV from smooth vergence testing - Risley Prism
PFV from step vergence testing - prism bar
PFV from vergence facility testing - BO
Negative relative accommodation (NRA)
Binocular accommodative facility (BAF, through plus)
Near point of convergence (NPC)
MEM retinoscopy / FCC
PFV behavior:
As BO is added, patient must converge to maintain bifoveal fixation and maintain accommodation at a given level (D or N)
As patient converges, accommodative response increases due to increased vergence accommodation
Patient must relax accommodation to counterbalance increased vergence accommodation (NRA)
When relaxation limit is reached, blur occurs
Accommodative convergence cannot be used when maintaining a fixed accommodation level; when accommodative convergence assists, blur is reported
Integrative analysis – PFV group data (continued)
Vergence facility testing:
Needs to maintain accommodative level at 2.50 D while using 12\Delta of PFV to restore bifoveal fixation
If lag of accommodation is normal, accommodative response for a 2.50 D stimulus will be 1.75–2.00 D
If sufficient fusional vergence, single and clear; if need both fusional and accommodative vergence, may be single but blurred
If cannot restore binocularity – diplopia
Negative relative accommodation (NRA):
Indirect measure of PFV; plus lenses added
Patient must relax accommodation to keep target single and clear; relaxation reduces accommodative convergence
Amount depends on AC/A ratio; NRA endpoint may reflect decreased PFV or inability to relax accommodation
Differentiate via monocular testing
Binocular accommodative facility (BAF):
Similar logic to NRA; must relax by ~2.00 D to keep clear
If AC/A = 5:1, divergence will be 10\Delta; thus 10\Delta PFV required to compensate for divergence
NPC:
Engages accommodative convergence, PFV and proximal vergence; reduced PFV may recede NPC; indirect measure of PFV
MEM/FCC:
Tested binocularity; normal MEM/FCC is +0.25 to +0.50 D; low PFV or exophoria often show less plus (overaccommodation); substituting accommodative convergence for PFV
Integrative analysis – NFV group data
NFV components include:
NFV from smooth vergence testing
NFV from step vergence testing
NFV from vergence facility testing
Positive relative accommodation (minus lenses used)
Binocular accommodative facility (BAF, through minus)
MEM retinoscopy / FCC
NFV behaviour:
As BI is added, patient must diverge to maintain bifoveal fixation and maintain accommodation at a given level (D or N)
As patient diverges, accommodative response decreases due to decreased vergence accommodation
Patient must stimulate accommodation to counterbalance decreased vergence accommodation
Integrative analysis – NFV group data (continued)
Vergence facility testing:
Needs to maintain accommodative level at 2.50 D while using 3\Delta of NFV to restore bifoveal fixation
If lag of accommodation is normal, accommodative response for a 2.50 D stimulus will be 1.75–2.00 D
If sufficient fusional vergence, will be single, clear; if using a decrease in accommodative convergence to aid fusional vergence, will be single but blurred; if cannot restore binocularity – diplopia
PRA (positive relative accommodation):
Indirect measure of NFV; patient must maintain convergence at a given level while changing accommodative response
Minus lenses added to stimulate accommodation; this increases accommodative convergence
Amount depends on AC/A ratio
NFV is required to counteract convergence (increasing accommodative convergence) to avoid diplopia
PRA endpoint may reflect decreased NFV or inability to stimulate accommodation
Differentiate through monocular testing
Binocular accommodative facility (BAF):
Similar to PRA; must stimulate 2 D of accommodation to keep clear; reflex increase in accommodative convergence
If AC/A = 5:1, convergence will be 10\Delta; thus 10\Delta NFV required to compensate for convergence
MEM/FCC:
Tested binocularly; normal MEM/FCC is +0.25 to +0.50 D
When NFV is low, there may be more plus (underaccommodation) to substitute for PFV
Reducing accommodation can reduce demand on NFV
Integrative analysis – accommodative system group data
Group includes:
Monocular amplitude of accommodation (AA)
Monocular accommodative facility (MAF) with plus and minus
MEM retinoscopy
Fused cross-cylinder (FCC)
Negative relative accommodation (NRA) and Positive relative accommodation (PRA)
Binocular accommodative facility (BAF)
Binocular amplitude of accommodation
Monocular amplitude of accommodation:
Total amount of accommodation available
Repeated testing (3–4x or at end of exam) provides information on sustaining ability
Low MAA in pre-presbyopic patients suggests accommodative insufficiency; supporting findings include poor MAF through minus, poor BAF through minus, reduced PRA
Adequate MAA does not guarantee absence of accommodative anomaly (e.g., facility issues or reduced NRA)
Monocular accommodative facility (MAF):
Ability to make rapid and large changes in accommodative level and sustain over 60 seconds
Outcomes:
Adequate performance with both plus and minus
Inadequate performance with both plus and minus
Indicative of accommodative infacility
Supporting findings: reduced BAF (plus and minus), low PRA and NRA
Adequate performance with minus, inadequate with plu
Overaccommodation, accommodative spasm or accommodative excess
Can be secondary to binocular vision condition; e.g. convergence insufficiency will overaccommodate to use accommodative convergence, constant overaccommodation can lead to accommodative spasm
Adequate performance with plus, inadequate with minus
Difficulty stimulating accommodation, will have reduced amplitude of accommodation
Accommodative insufficiency, ill-sustained accommodation
Supporting findings: low PRA, high MEM and FCC
MEM retinoscopy / FCC:
Measure of actual accommodative response
Normal: +0.25 to +0.50 D for a 2.50 D stimulus
More plus suggests accommodative insufficiency; supportive findings: low PRA, high FCC, reduced MAF/BAF through minus
Less plus suggests accommodative spasm or excess; supportive findings: low NRA, reduced MAF through plus
lead = over accommodation
might be sign of an accommodative spasm
lag = under accommodation.
accommodative insufficiency
Binocular accommodative facility (BAF):
Useful for identifying an accommodative anomaly when binocular findings are normal
If abnormal binocular findings, BAF alone cannot distinguish between isolated accommodative anomaly or binocular vision anomaly
Integrative analysis – vertical fusional vergence data
Supravergence and infravergence
Right infravergence is a compensatory mechanism for right hyperdeviation
BU in front of RE
Right supravergence is a compensatory mechanism for right hypodeviation
BD in front of RE
Also applicable to left eye
Vertical fixation disparity testing
Associated phoria = prism amount that reduces fixation disparity to zero
Accepted method of prism correction for vertical deviations
vertical fusional vergence is common in patients with a 4th nerve palsy.
Ocular motor data
Fixation status
Saccadic ability
Pursuit ability
Diagnosing conditions (Integrative analysis - diagnosing condition)
Heterophoria with:
Low AC/A
Convergence insufficiency or Divergence insufficiency (depending on pattern)
Normal AC/A with:
Fusional vergence dysfunction (orthophoria D and N)
Basic esophoria or basic exophoria
High AC/A
Convergence excess or Divergence excess
Vertical heterophoria
Accommodative anomalies:
Accommodative insufficiency
Ill-sustained accommodation
Accommodative excess
Accommodative infacility
Ocular motor dysfunction
If signs & symptoms are greatest at near → convergence insufficiency or excess
insufficiency: exo at near
excess: eso at near
give minus at near due to high AC/A
if signs & symptoms are greater at distance → divergence insufficiency or excess
insufficiency: eso at distance
excess: exo at distance
give minus at distance due to high AC/A
low AC/A (insufficiency) don’t respond well to plus or minus → generally require prism (BO)
Integrative analysis - advantages
Includes analysis of ocular motor, accommodative facility, vergence facility, MEM retinoscopy and fixation disparity data
No other approach uses all of this data