Demand and Consumer Choice
Overview
Main Topics:
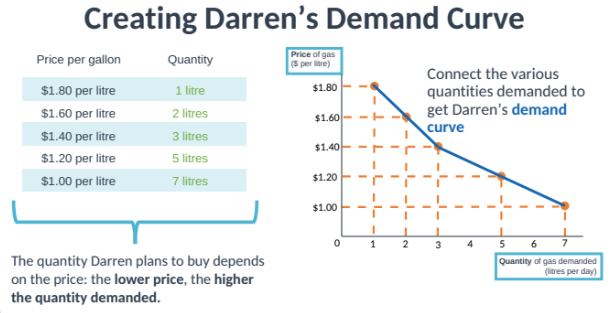
Individual Demand: Personal buying plans at various prices(buying only a small amount when prices are high, buying more when prices dip).
Market Demand: Aggregate demand in the market.
Shifts vs. Movements Along Demand Curves: Understanding changes in quantity demanded versus changes in demand.
Key Concepts
Individual Demand Curve:
Definition: A graph showing the quantity of an item an individual plans to purchase at each price.
Example: If a favorite product's price decreases, the quantity demanded increases.
Law of Demand: As price decreases, the quantity demanded increases, creating a downward-sloping demand curve.
demand = marginal benefit.
Market Demand Curve:
Definition: A graph plotting the total quantity demanded by the entire market at various prices.
Built by aggregating individual demand curves.
Buying plan
higher price = buy less units = lower ability(to buy)
lower price = buy more units = higher ability(to buy)
Individual Demand: Factors and Principles
change in quantity demanded vs change in damand
price response (all else equal)
higher price less demand (decrease in quantity in demand)
lower price higher demand (increase in quantity demanded)
change demand
response to factors other than price of the same product
Ceteris Paribus (Holding Other Factors Constant):
Demand curves assume all other factors remain unchanged except price.
Changes in external factors (e.g., income, preferences, season, weather, natural disasters) require a new demand curve.
if a similar product costs less consumers will buy the cheaper product.
The Rational Rule for Buyers:
Buy more of an item if its marginal benefit is greater than or equal to the price.
Stop buying when price equals marginal benefit to maximize economic surplus.

Diminishing Marginal Benefit:
Each additional unit of a good provides less benefit than the previous one.
Leads to downward-sloping demand and decreasing willingness to pay for additional units.
Market Demand
Building the Market Demand Curve:
Survey potential customers to gather data.
Aggregate individual quantities demanded at each price.
Scale quantities to represent the entire market.
Plot the aggregated data to form the curve.
Characteristics:
Downward Sloping: Reflects the law of demand.
Movements Along the Curve: Caused by price changes alone.
Shifts in the Curve: Caused by changes in factors like income, preferences, or related goods.
A decrease in demand, shifts the demand curve to the left, decreasing the quantity at each and every price.
An increase in demand shifts the demand curve to the right, increasing the quantity at each and every price.
Factors That Shift the Demand Curve
Income:
Normal Goods: Demand increases with higher income.(newesrt iphone, restaurants, organic foods)
Inferior Goods: Demand decreases with higher income.(fast food processed foods, second hand items)
(with a recession and people not having a job or money, budget airlines like Cargojet stocks rose while Air Canada dropped during Covid)
Preferences:
Influenced by life events,(If you have a baby, your demand for daycare will be higher than it was prior)
Marketing, (Tik tock trends had influenced the demand for feta cheese and tomatoes or cucumbers)
Societal trends, (environmental awareness has many people looking for reusable/biodegradable products)(decreasing demand for single use plastic)
Seasons.(demand for 6-foot pine trees soar during December and demand for bathing suits climb during the spring summer)
Prices of Related Goods:
Complements: Goods consumed together (e.g., hot dogs and buns, moues and mouse pad).
Substitutes: Goods replacing each other (e.g., Coke and Pepsi, Orville Redenbacher and great value).
Expectations:
Anticipations about future prices or availability affect current demand.(if gas is expensive today you might fill up in a few days when it might be lower. If spaghetti is on sale and macaroni is not, you might chose to make spaghetti for supper instead of macaroni.)
Congestion and Network Effects:
Network Effect: Increased usefulness as more people use it.(why use facebook to keep up with your young friends when they all use snapchat)
Congestion Effect: Reduced value due to overuse.(to many people use Preston ave to go south and it gets busy and backed up, instead you use cumberland)
Type and Number of Buyers:
Changes in demographics or market size influence demand.(because of the one-child policy in china, there is high demand for workers)
Shifts vs. Movements
Movements Along the Curve:
Caused only by price changes.
Reflect changes in the quantity demanded.
Shifts of the Curve:
Result from changes in external factors.
Represent a change in demand.
Key Takeaways
Individual Demand Curve: Based on personal buying plans and influenced by diminishing marginal benefits.
Market Demand Curve: Aggregates individual demand and reflects overall market trends.
Shifts in Demand: Driven by factors like income, preferences, or external events.
Movements Along Demand Curve: Solely price-driven changes in quantity demanded.