Smartbook Chapter 1.docx
LO 1-1: Explain how increasing data availability and computerization are shaping the accounting profession.
The amount of data available continues to explode. There are 2.5 quintillion bytes of data created each day, which continues to accelerate. Over the last two years alone, 90 percent of the data in the world was generated. 1 Exhibit 1.1 shows this surge of data does not show any signs of slowing down. The increasing amount of data available to the accountant can both help and hinder the accountant and their work. The abundance of data can be helpful in addressing company questions, problems, and challenges to the extent the accountant can harness and analyze the available data. However, the increasing amount of data may hinder the work of the accountant through information overload , where too much information may not be properly synthesized or interpreted.

LO 1-2: Describe the critical thinking skills accountants must develop to address accounting questions with data.
To illustrate, we turn to Bloom’s Taxonomy , which provides a hierarchical view of critical thinking skills. As shown in Exhibit 1.2 , the set of critical thinking skills go from the lowest levels in
remembering,
understanding, and
applying, to higher levels of thinking in
analyzing,
evaluating, and
creating.
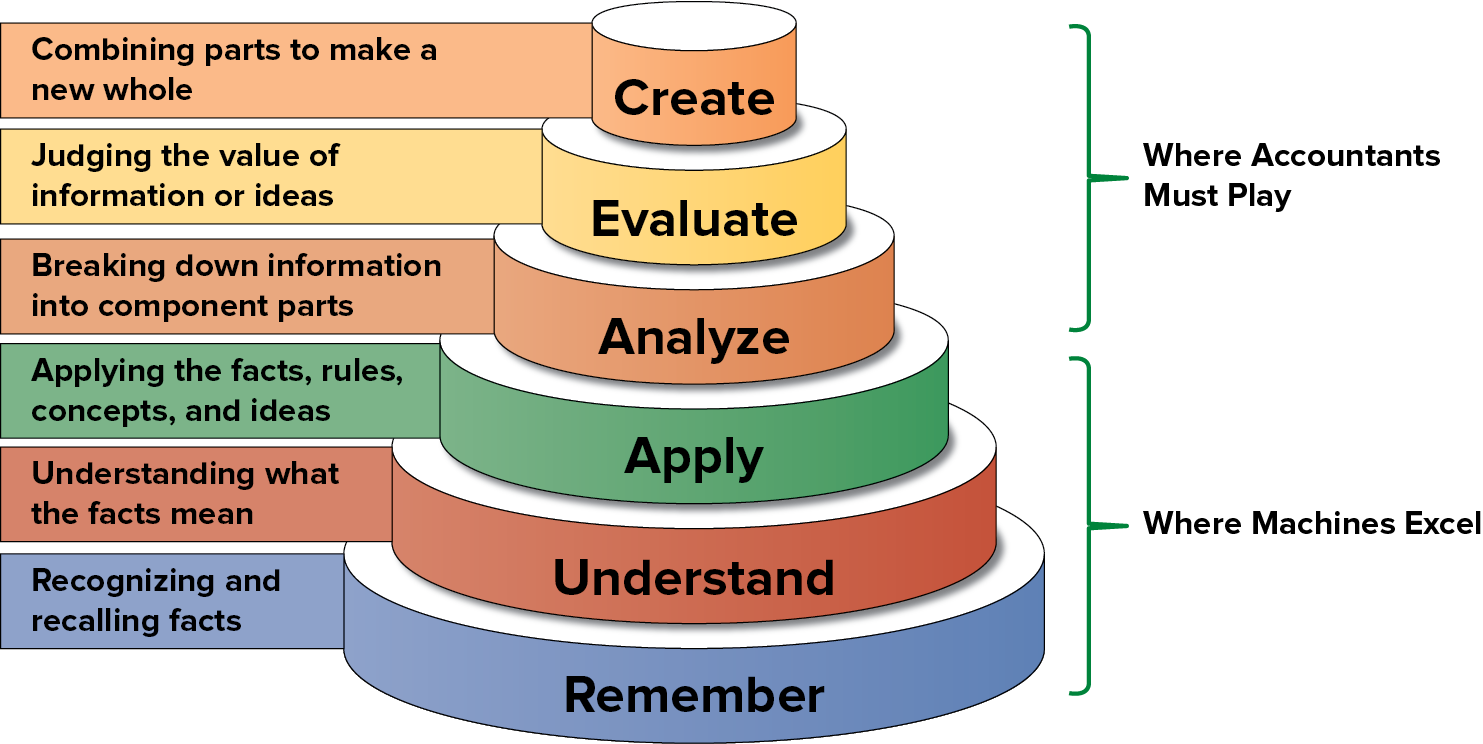
The basic academic accounting classes like “Accounting Principles,” “Introduction to Financial Accounting,” or “Introduction to Managerial Accounting” primarily address the remember, understand, and apply skills as noted in Bloom’s Taxonomy. Yet these are the same skills that computers now perform more reliably than do accountants.
As the accounting profession moves to higher-order critical thinking skills—including analyzing, evaluating, and creating information most valuable to decision makers—it generates more value to the organization. 4 Indeed, it is these higher-order critical thinking skills that we believe will be a place where accountants can take advantage of the explosion of available data for accountants to analyze and harness. In other words, Bloom’s Taxonomy offers a framework to think about the higher order critical thinking skills, which both accounting firms and companies that employ accountants now expect accountants to have. 5
To be clear, accountants need to master all levels of critical thinking skills shown in Bloom’s Taxonomy from the lowest to the most advanced skills. Accountants simply cannot analyze, evaluate, and create if they have not mastered the basic accounting knowledge and understanding required by the lower-level skills of remembering, understanding, and applying levels of critical thinking. The challenge then is to move beyond the basics to develop higher-order critical thinking skills.
GenAI is a type of artificial intelligence (AI) that analyzes large datasets and “generates” new audio, images, music, text, videos, and other content in the response to user prompts.GenAI tools like ChatGPT, Gemini, and Microsoft Copilot make it easy for anyone to describe using natural language the results they would like to see and analyses they would like to perform, and the tools will generally produce the output as instructed. This means an analyst must understand “prompt engineering” or how to direct the tools with specific directions and in a way that will generate the desired results.
LO 1-3 Describe how the AMPS model outlines the Data Analytics Process.
Recall the analytics mindset proposed by EY (from the chapter-opening vignette) that their accounting professionals will ultimately need. Exhibit 1.3 details the components of the analytics mindset:
Exhibit 1.3 The Analytics Mindset
Ask the right questions.
Extract, transform, and load relevant data.
Apply appropriate data analytic techniques.
Interpret and share the results with stakeholders.
Closely related to the analytics mindset is the use of a model we propose that explains the steps involved in the Data Analytics Process. We define data analytics as the process of evaluating data with the purpose of drawing conclusions to address all types of questions (including accounting questions).
We call this framework the AMPS model , which stands for the following (and the chapter(s) where each step is developed further):
A sk the Question ( Chapter 1 ).
M aster the Data ( Chapter 2 – Chapter 4 ).
P erform the Analysis ( Chapter 5 – Chapter 9 ).
S hare the Story ( Chapter 10 ).
Note how each component of the analytics mindset corresponds to a specific step of the AMPS model. In each lab of the textbook, we promote the AMPS model to go from asking the question to communicating the results by sharing the story.
The AMPS Model: Ask the Question
Questions like “What happened? What is happening?” (forming the basis of descriptive analytics). These types of questions include:Did we make a profit last year?
Did return on assets improve or decline over the past year?
Did the airline company’s on-time departures improve this past month?
How much did we pay in state taxes last year?
How long have the existing accounts receivable been past due?
Which product is the most profitable one for the company?
Questions like “Why did it happen? What are the root causes of past results?” (forming the basis of diagnostic analytics). These types of questions include:
Why did sales, general, and administrative expenses increase relative to the industry?
Why did overall taxes paid decrease even though net income increased?
How did the journal entry and approval of various transactions violate the segregation of duties?
Can our variance analysis help explain why the labor expenses increased over the past year?
Questions like “Will it happen in the future? What is the probability something will happen? Is it forecastable?” (forming the basis of predictive analytics).
These types of questions include:What is the risk of bankruptcy for each company in our portfolio?
Can we predict whether customers will repay their loan based on customer background (credit score, employment record, existing debt)?
Can the IRS find those individuals or corporations evading taxes using predictive techniques?
Can we predict if or when the financial statements might be misstated?
Questions like “What should we do based on what we expect will happen? How do we optimize our performance based on potential constraints?” (forming the basis of prescriptive analytics). These types of questions include:
If we have all 12/31 year-end audit clients, how will we organize our audit work in the new year?
What is the level of sales that will allow us to break even?
Should the company rent or lease its headquarters office building?
Should the company make its products or outsource to other manufacturers?
How do we adjust product mix to maximize profits?
How do we price the product to maximize profits?
The AMPS Model: Master the Data
Once the accountant specifies the question, he/she starts to consider the most appropriate data that could be used. Accountants need to understand the trade-offs between relevant data and reliable data (such as that data which might exhibit more representational faithfulness). Does the data exhibit high levels of data integrity , where data is accurate, valid, and consistent over time? Are the data considered to be factual or opinion-based?
Page 10
Accountants also need to understand the trade-offs between data that are well organized (like a financial statement or a spreadsheet) or not well organized (like an Instagram post); data internal or external to the company; and even the potential cost of acquiring, preparing, and analyzing the data as compared to the potential value provided by use of the data.
The AMPS Model: Perform the Analysis
There are many possible analyses we can do with the data to help address the question. Different questions require different types of analyses, including descriptive, diagnostic, predictive, and prescriptive analytics. A variety of analytics techniques are available to help perform the different analyses, including the following:
A data
visualization such as a histogram or a scatterplot might be used to help evaluate journal entries that are excessively big or excessively small (or negative) with the testing of internal controls.Regression analysis might be used to evaluate cost behavior by segregating total costs into fixed and variable cost components.
A pivot table might be used to summarize the accounts receivable aging or post journal entries to a trial balance.
The AMPS Model: Share the Story
Once we’ve performed the analytics, it is important to share the story by communicating the results to decision makers. One way to communicate would be through the use of visualizations , where decision makers can view the information represented by a graph, chart, or other image that might help them more fully grasp content being communicated.
Would it be more effective to have a written report, a graph, a dashboard (a graphical summary of various measures tracked by a company), or all three to most effectively communicate information to a specific decision maker? If it is a one-time analytics, the results might be static and need to be performed just once or even annually (or quarterly) as new accounting results come out. If the analytics need to be done daily, weekly, or continuously, perhaps a graph or chart that is more dynamic updating on a continuous basis might be the most appropriate way to communicate results. Chapter 10 addresses ideas on how to best “share the story” with decision makers.
The Recursive Nature of the AMPS Model
After completing all steps of the AMPS model, the decision maker often is more knowledgeable and therefore better able to ask deeper, more refined questions, which suggests the AMPS model should best be viewed as cyclical in nature. Data Analytics might be viewed as successively peeling the layer of an onion. By peeling the first layer of the onion, you see the next layer and evaluate it and remove it to get to the third layer, and so on.
LO 1-4 Describe the use of common visualization types to analyze data and communicate results.
Exhibit 1.5 Purposes of Data Visualization, Business Examples, and Visualization Types

LO 1-5 Evaluate th e available software tools and assess their ability to acquire and prepare, analyze, and visualize data.
Exhibit 1.7 Analysis and Visualization Software Tools by AMPS Model Step and Data Analysis Specialty
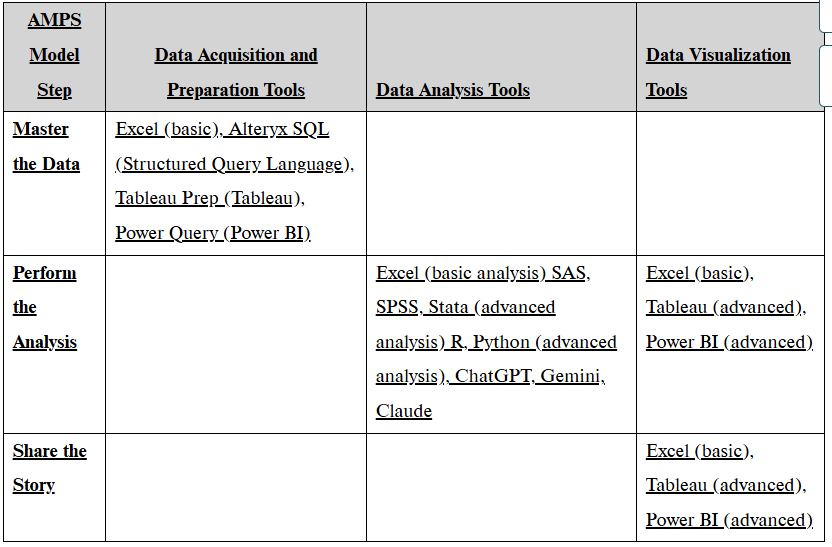
Data Acquisition and Preparation Tools. The software tools used to access the data and get it ready for data analysis (covered in Chapter 3 and Chapter 4 ) include the following:
Excel (basic)
Alteryx
SQL ( S tructured Q uery L anguage)—used to access specific data from very large datasets.
Tableau Prep and Power BI (Power Query)
Data Analysis Tools. The software tools used to analyze data include the following (analytics techniques covered in Chapter 5– Chapter 9 ):
Excel (basic analysis)—analysis tools available in Excel include:
PivotTables—often a very functional tool for many types of summarizations; also serves to help organize the data. PivotTables allow reorganization and summarization of certain data using crosstabulations without changing the underlying spreadsheet (or data).
Data Analysis Toolpak—access to specific analysis techniques, including descriptive statistics, histograms, correlation, and regression.
SAS, SPSS, Stata—software analysis tools that emphasize statistics
R and Python—programming software tool used to perform advanced data analysis (covered in advanced data analysis course)
GenAI - ChatGPT, Gemini, Claude, Copilot, or other GenAI tools—with the right guidance and natural language prompts, these tools can perform analyses, create visualizations, and explain relationships in the data.
Data Visualization Tools. Tools used to analyze and communicate data to decision makers (covered in Chapter 10 ) include the following:
Excel (basic visualizations)
Tableau
Power BI
GenAI